
With the 2017 Restoring Internet Freedom Order published in the Federal Register, the shot clock begins for legal challenges to the Federal Communication Commission’s (FCC’s) order.
The comment process for the order has been harshly criticized, with some going as far as saying the order should be nullified because of it. The New York Attorney General recently said, “Millions of fake comments have corrupted the FCC public process,” and “moving forward with this vote would make a mockery of our public comment process and reward those who perpetrated this fraud to advance their own hidden agenda.”
Such concerns raise two questions. First, did the 2017 comment process, which largely repealed the 2015 Open Internet Order, differ significantly from the comment process in 2014 that led to the Open Internet Order? Second, do the two rulemakings together yield lessons for the comment process itself?
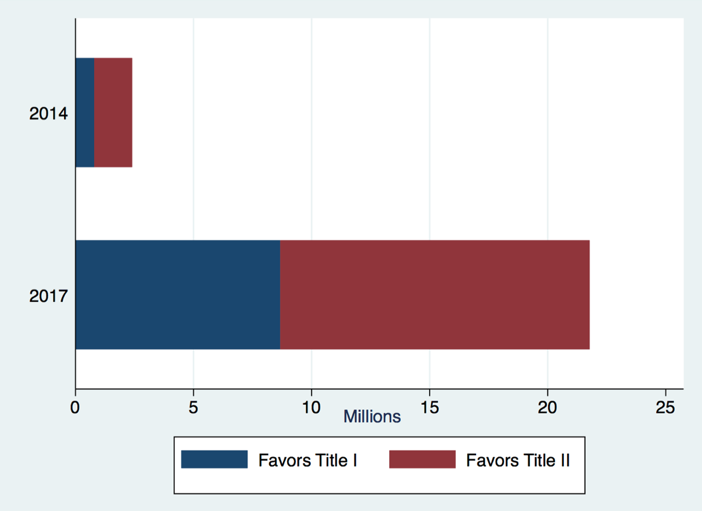
We use data analytics and sentiment analysis to compare the 22 million comments in 2017 to 2.5 million comments from the 2014 Open Internet docket to answer these questions. [1]
Total Comments Received in Favor of Title I and of Title II in 2014 and 2017
We find that the comment process in 2014 suffered from the same criticisms leveled at the process in 2017.
For example, Commissioner Rosenworcel noted in her comments at the 2018 State of the Net Conference instances in the 2017 comments where individuals’ names were used without their permission. But in 2014, email addresses were reused to submit different letters, duplicate submissions were sent under the same name, and mailing addresses were unverified and often fictional. These all raise concerns about fraudulent submissions.
Form letters also constituted the bulk of comments in both years: 76 percent in 2014 and 90 percent in 2017.
A major difference from 2014 to 2017 is that bulk comments and form letters became more sophisticated. In 2014, form letters were simply the same letter submitted under multiple names. These were simple to identify. But in 2017, some groups improved their technology so that their form letters used rotating keywords ordered in different combinations. These form letters presented more of a challenge to separate from unique letters.
The takeaway from this change in form letters is that groups are becoming better at interacting with the comment process to create the illusion of unique, legitimate submissions. These were still detectable in 2017, but the next controversial issue is sure to yield even more sophisticated mass-submissions designed to look like unique letters.
While we have no evidence about other agencies, these problems are unlikely to be confined to the FCC. In short, Commissioner Rosenworcel was correct to warn about the problems facing the comment process in general when she noted that, “Something is not right—and what is wrong here is not confined to the FCC… We know that five agencies—the FCC, the Department of Labor, the CFPB, the SEC, and FERC—have had problems with stolen identities and fake comments in the public record.”
Regardless of how one feels about Title I and Title II, a logical conclusion is that federal agencies must take the threat to the comment process seriously and prepare for future sophistication by those who wish to use it for their own purposes.
In the remainder of this post we more carefully compare the 2017 and 2014 comments.
Form Letters
Form letters dominated submissions in 2014 and 2017.
In 2014, 76 percent of all comments were easily recognizable form letters, consistent with an analysis by the Sunlight Foundation. Most of the comments in favor of the 2014 order—700,000—used identical text.[2] Comments opposing the 2014 order consisted of 25 distinct form letters, submitted in bundles of approximately 25,000 comments.[3]
Share of Types of Comments in 2014 and 2017
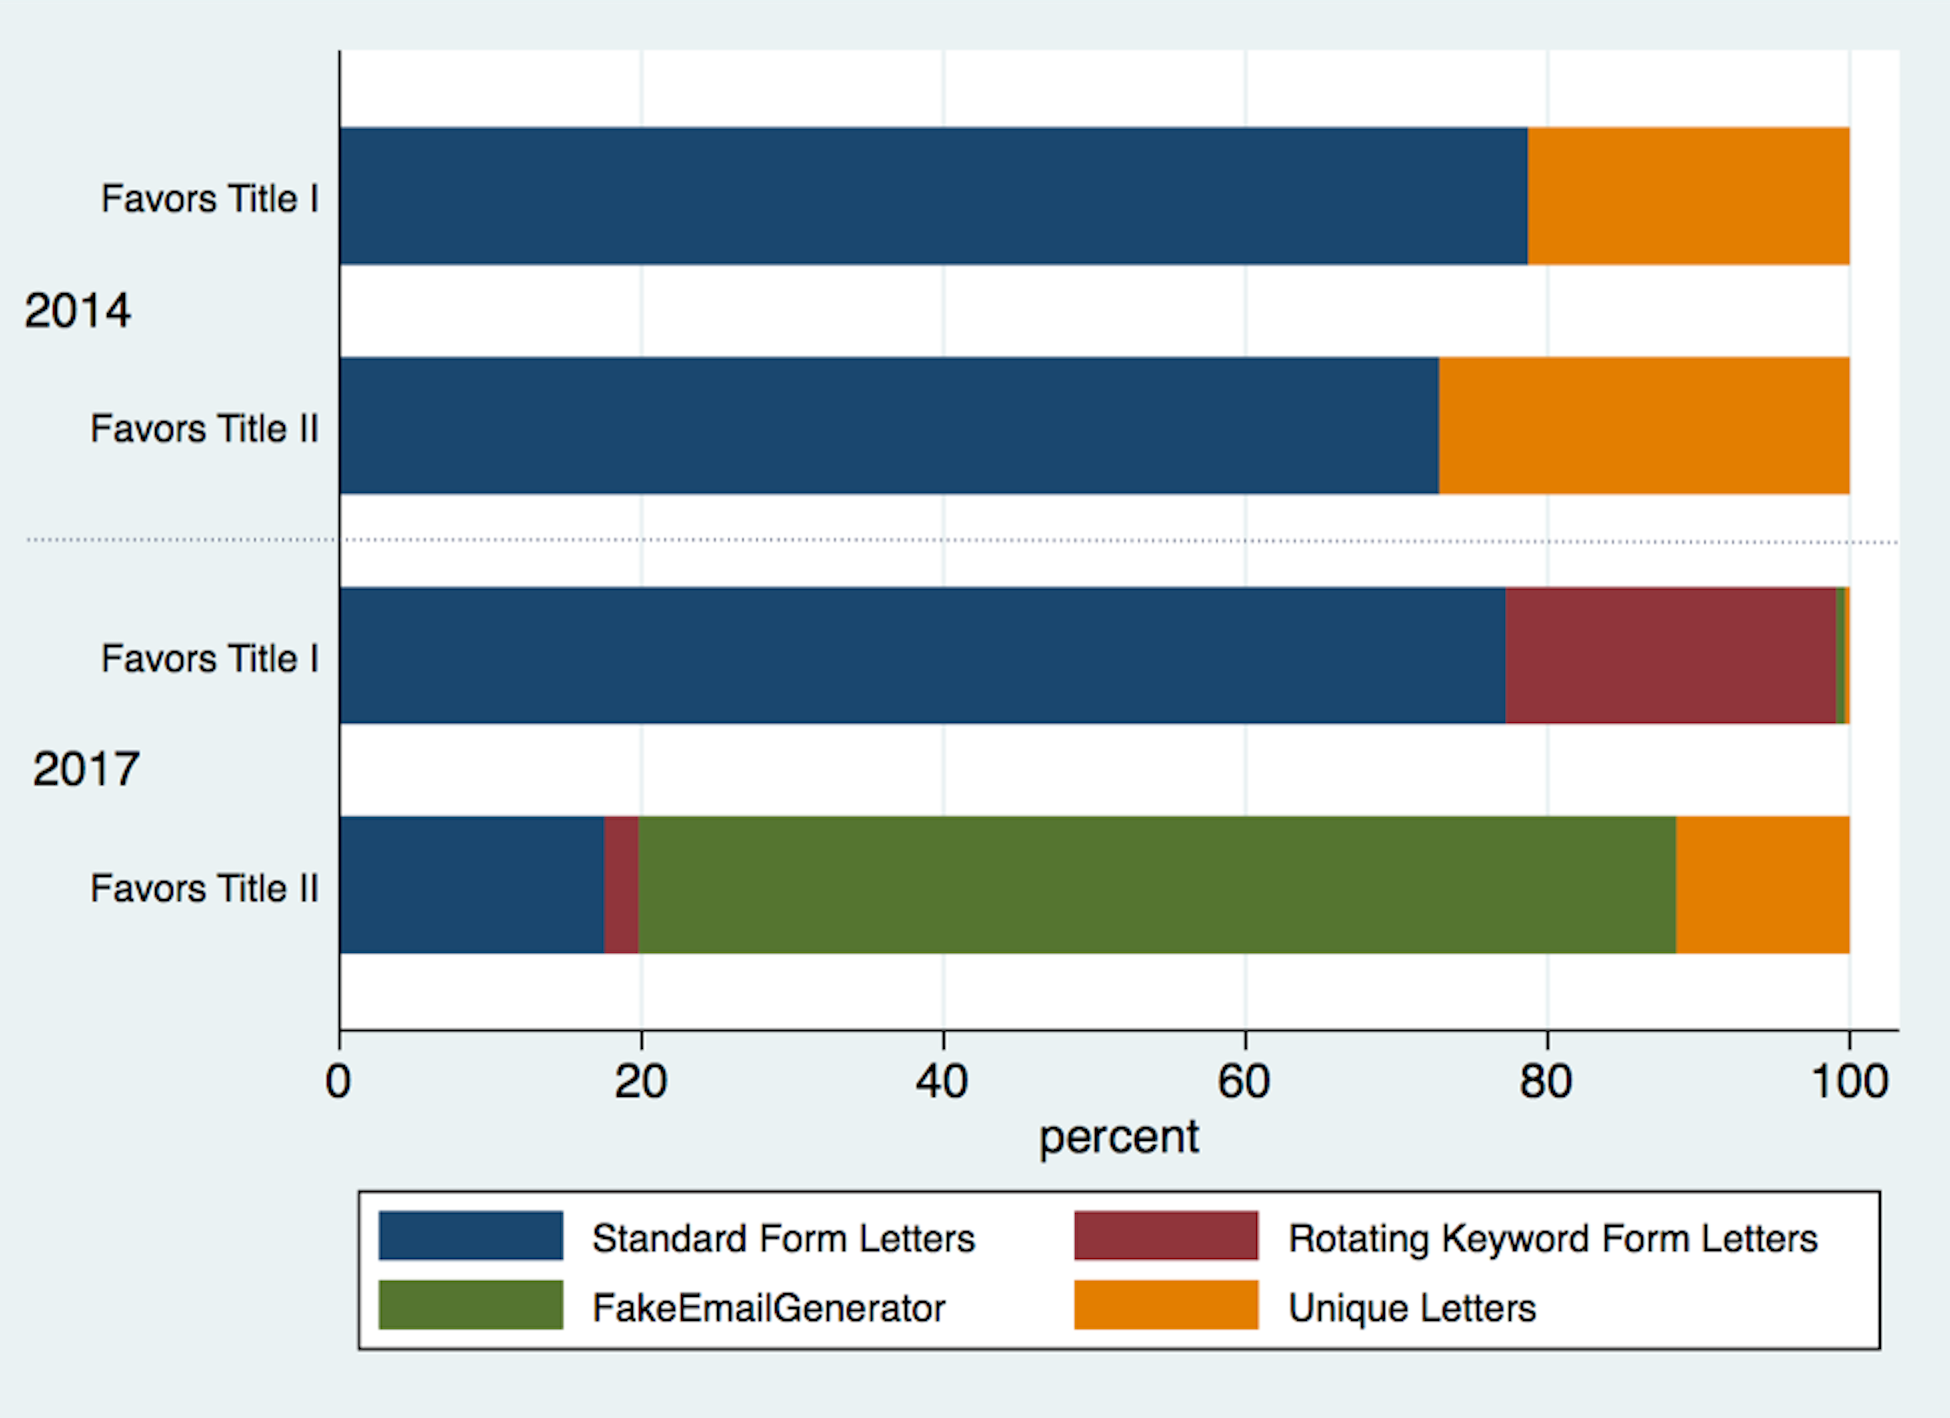
In 2017, 90 percent of all comments were form letters. These were more sophisticated than the 2014 form letters, using alternating phrases and keywords to generate distinct paragraphs of text. As a result, identifying form letters was more challenging in 2017 than in 2014. On the other hand, the liberal use of FakeEmailGenerator to generate email addresses made identifying fake comments relatively easy in 2017.
Intensity of Preferences
Net neutrality has become a populist issue. The larger number of comments in 2017 suggest that more people care about the issue, but we also want to know whether people care more intensely than they did previously.
We used sentiment analysis to measure the intensity of commenter preferences to explore how intensely people feel about the issue. We generated sentiment scores of positivity of language from random samples taken from comments in the two proceedings.[4] The average sentiment score increased from 2014 to 2017, meaning that, on average, comments were more likely to use positive words in the more recent proceeding.[5], [6]
Distribution of Sentiment in 2014 and 2017
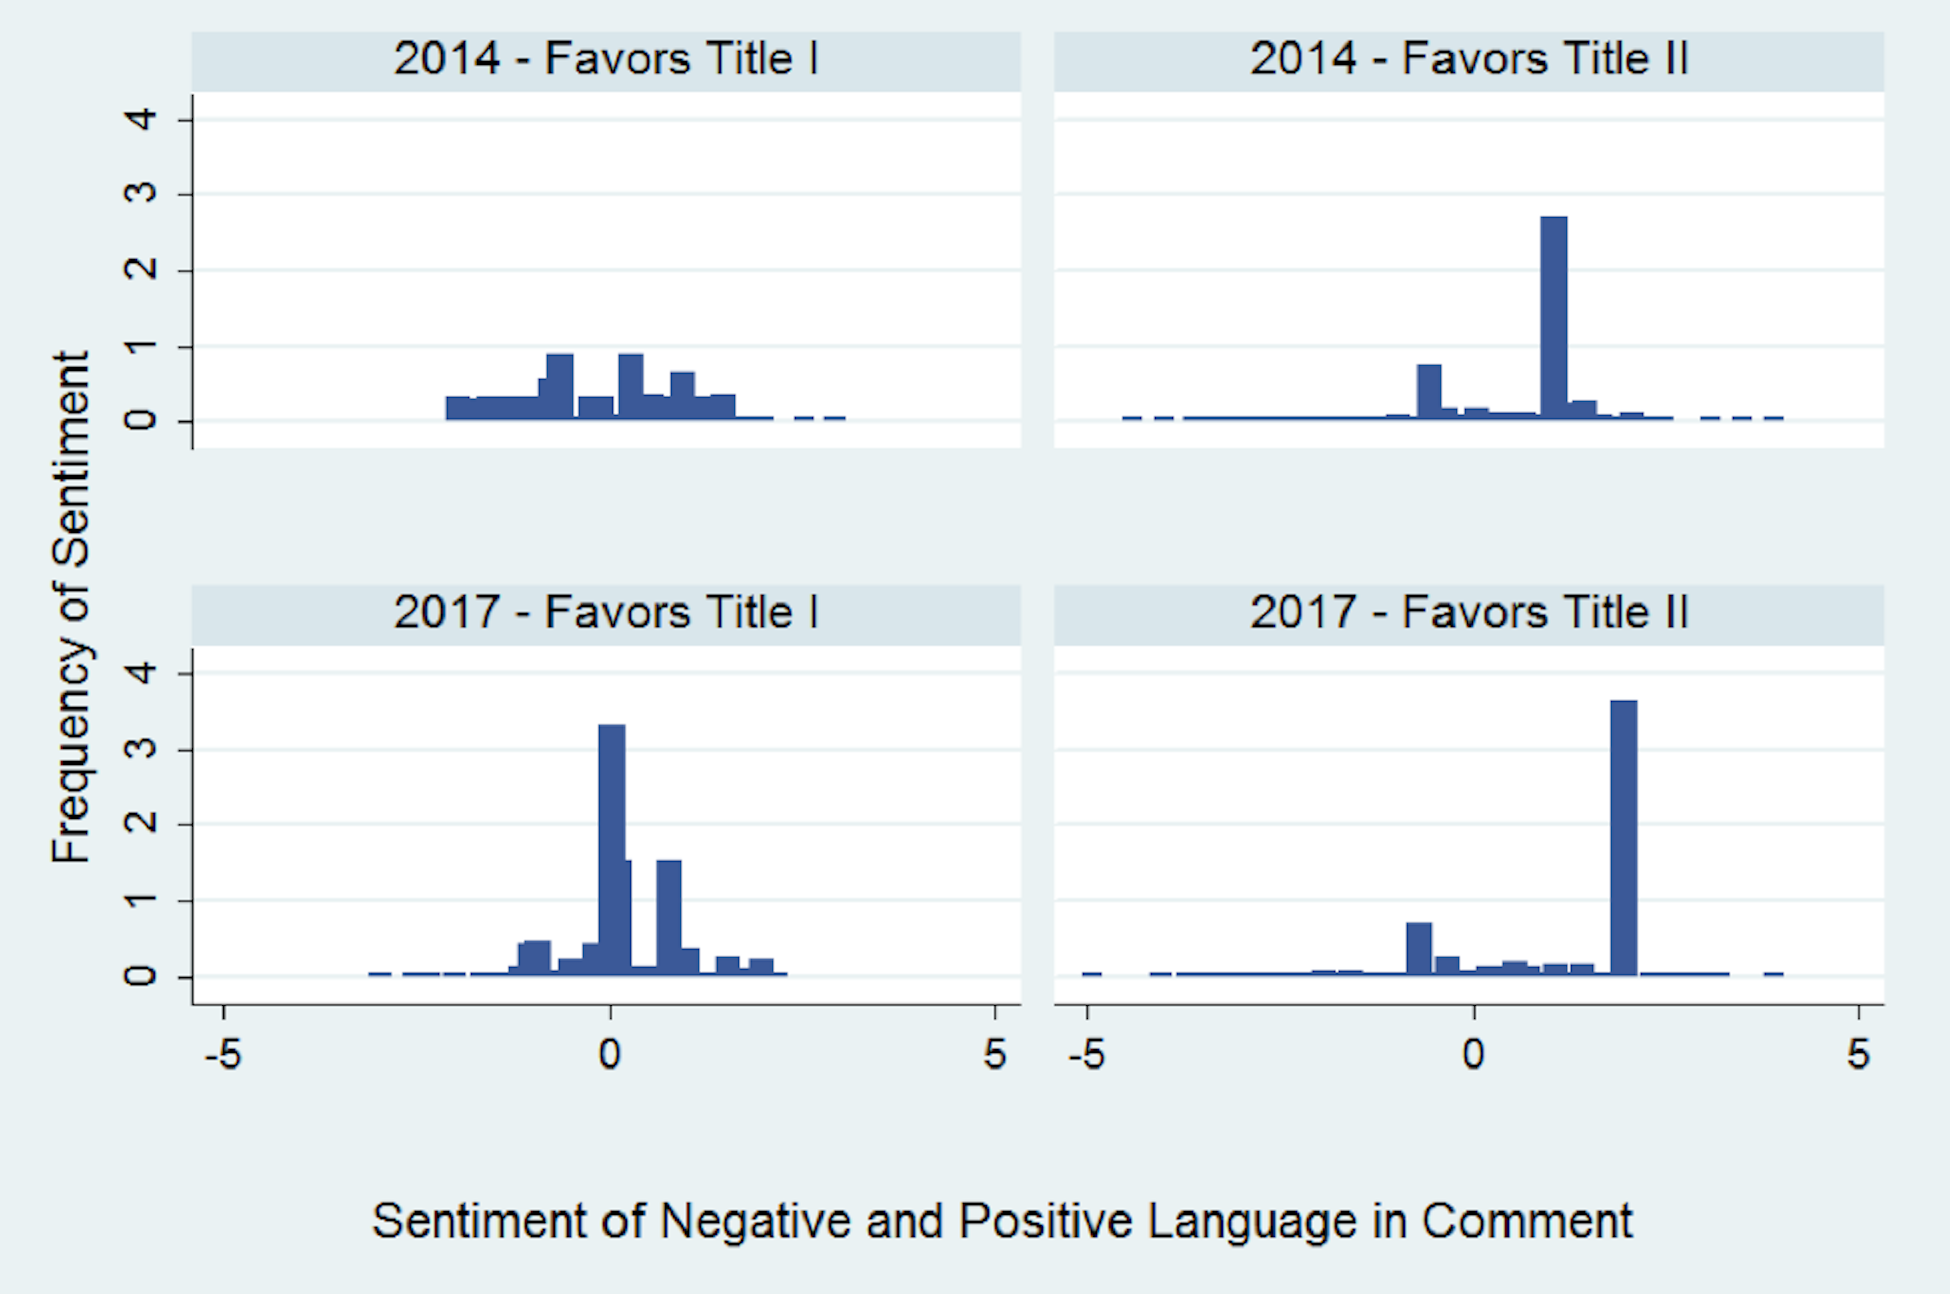
This result may seem surprising given the ferocity of the 2017 debate and stories of negativity on Twitter. The negativity was real, but is because of long tails, not the typical commenter.
In particular, we found significantly more variance in 2017 than in 2014 among supporters of Title II.[7] In other words, while the average comment—including among Title II supporters—used somewhat more positive language, some Title II supporters were more likely to use extreme language, especially negative, in 2017 than in 2014.
Given their prevalence, form letters in both years, among supporters and opponents, drive the average scores, meaning that the form letters used more positive language in 2017 than in 2014. One question is whether groups organizing form letters made this change intentionally, perhaps thinking positive language was more likely to influence the agency, or whether it was merely coincidence. Another implication is that unique senders are responsible for most of the variance in sentiment scores of language in the letters.
Conclusion
Criticisms of the 2017 Restoring Internet Freedom process apply also to the 2014 Open Internet process. A key difference between the comment process in 2017 compared to 2014 is that form letters became more sophisticated and more difficult to identify. In the future, bad actors are likely to continue improving their ability to make form letters appear unique, hide their origins, or simply make the comment process unmanageable.
Although the APA mandates that federal agencies rely on substantive comments with scientific data, facts, and expert analysis of proposed rules and not treat comments as “votes,” the integrity of the comment process matters.[8]
Federal agencies must learn how to handle these problems in order to maintain a meaningful comment process. Doing so will require agencies to more carefully consider systems to verify or authenticate filings when they are submitted, and devote increasing resources to computing, data forensics, textual analysis, time, and talent to evaluate the submissions.
Endnotes (because blogs always have endnotes, right?)
[1] We found inconsistencies in the FCC’s 2014 statements on the number of comments received (3.9 million) and the comments in the electronic record (2.1 million). We agree with the Sunlight Foundation’s analysis: “As was true in round one, we fail to see how the FCC arrived at the count that was widely publicized. Clearly, 1.67 million documents is far short of 2.5 million, the number reported in the commission’s blog post. We spent enough time with these files that we’re reasonably sure that the FCC’s comment counts are incorrect and that our analysis is reasonably representative of what’s there, but the fact that it’s impossible for us to know for sure is problematic…” https://sunlightfoundation.com/2014/12/16/one-group-dominates-the-second-round-of-net-neutrality-comments/. Our dataset of 2.5 million comments falls short of the 3.9 million comments the FCC reports receiving. We generated a dataset of 2.1 million comments from Docket 14-28 from the FCC’s ECFS API (from dates 1/1/2014 to 1/1/2015) and 446,000 comments in the Raw XML file of reply comments, https://www.fcc.gov/news-events/blog/2014/10/22/fcc-releases-open-internet-reply-comments-public. The link to the first Raw XML file with 700,000 comments does not appear to be available.
[2] “Dear Chairman Wheeler: We are writing to urge you to implement strong and unambiguous net neutrality rules that protect the Internet from discrimination and other practices…”
[3] “Regulating the Internet is the first step in regulating the people who use it. We are a free people, and the FCC needs to leave us alone…“
[4] We applied the same sentiment dictionary (AFINN in R) to random samples of comments from both datasets (25,000 of 2.5 million comments from 2014 and 220,000 of 22 million comments from 2017).
[5] We apply statistical tests to compare differences in sentiment scores. Using a nonparametric Wilcoxon rank-sum test, we find that the two samples are from populations with different statistical distribution of intensity of preference. Using a nonparametric equality-of-medians test, we also find that the median sentiment scores for comments are statistically different. The median sentiment scores across years, across intent, or for intent within years or years within intent, are statistically different. https://www.stata.com/manuals13/rranksum.pdf
[6] In 2014, the average sentiment score was 0.43. In 2017, the average score was 0.83, using a scale of -5 (most negative) to +5 (most positive). Comments that favored Title I became more positive, with a higher average sentiment score increasing from -0.14 in 2014 to 0.65 in 2017. Comments that favored Title II also became more positive with increased average sentiment score from 0.19 to 1.25.
[7] In 2014, the standard deviation of sentiment scores that favored Title I was 0.98, but fell to 0.76 in 2017. For comments that favored Title II, the standard deviation of sentiment scores increased to 1.14 from 0.68.
[8] https://www.federalregister.gov/uploads/2011/01/the_rulemaking_process.pdf (“This process is not like a ballot initiative or an up‐or‐down vote in a legislature. An agency is not permitted to base its final rule on the number of comments in support of the rule over those in opposition to it. At the end of the process, the agency must base its reasoning and conclusions on the rulemaking record, consisting of the comments, scientific data, expert opinions, and facts accumulated during the pre‐rule and proposed rule stages.”)

Sarah Oh Lam is a Senior Fellow at the Technology Policy Institute. Oh completed her PhD in Economics from George Mason University, and holds a JD from GMU and a BS in Management Science and Engineering from Stanford University. She was previously the Operations and Research Director for the Information Economy Project at George Mason School of Law. She has also presented research at the 39th Telecommunications Policy Research Conference and has co-authored work published in the Northwestern Journal of Technology & Intellectual Property among other research projects. Her research interests include law and economics, regulatory analysis, and technology policy.

Scott Wallsten is President and Senior Fellow at the Technology Policy Institute and also a senior fellow at the Georgetown Center for Business and Public Policy. He is an economist with expertise in industrial organization and public policy, and his research focuses on competition, regulation, telecommunications, the economics of digitization, and technology policy. He was the economics director for the FCC's National Broadband Plan and has been a lecturer in Stanford University’s public policy program, director of communications policy studies and senior fellow at the Progress & Freedom Foundation, a senior fellow at the AEI – Brookings Joint Center for Regulatory Studies and a resident scholar at the American Enterprise Institute, an economist at The World Bank, a scholar at the Stanford Institute for Economic Policy Research, and a staff economist at the U.S. President’s Council of Economic Advisers. He holds a PhD in economics from Stanford University.