The Emergency Broadband Benefit (EBB) Program is in its tenth week. This post examines how its benefits are distributed across the country based on weekly data released by the Universal Service Administrative Company (USAC) combined with statistical tools built into TPI’s Broadband Map.
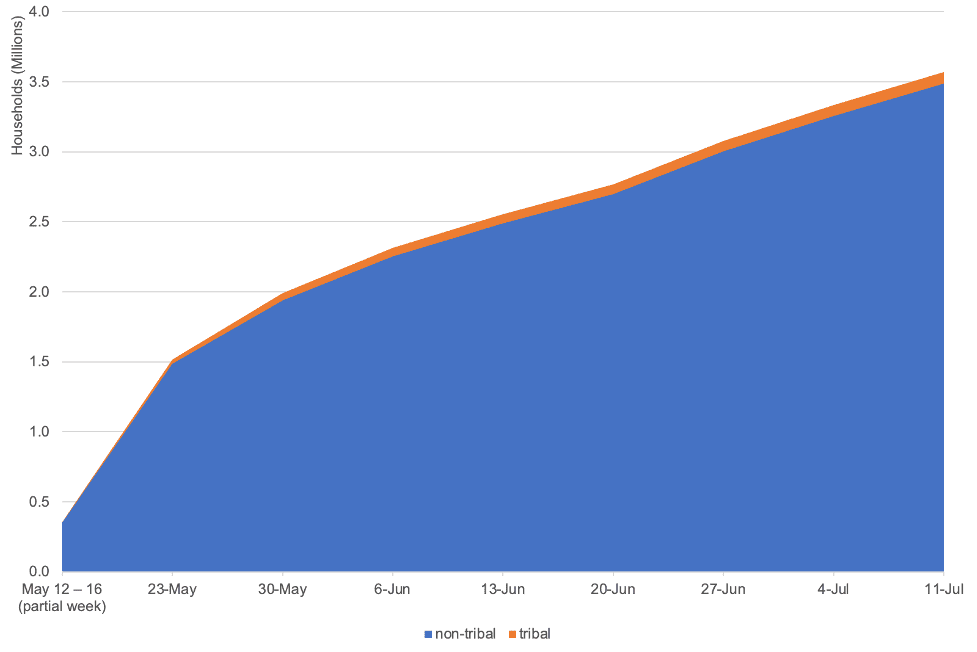
USAC shows that by week ending July 11, almost 3.6 million households had participated in EBB. As of July 15, USAC had not updated the amount of subsidy support claimed. The most recent listing includes data only through May, at which time only $34.6 million of $3.2 billion has been claimed.
Mapping Enrollment Across the Country
The data as processed through TPI’s map shows how signups are distributed around the country. The map below shows signups by state for the continental U.S. as a share of the total number of households in the state.
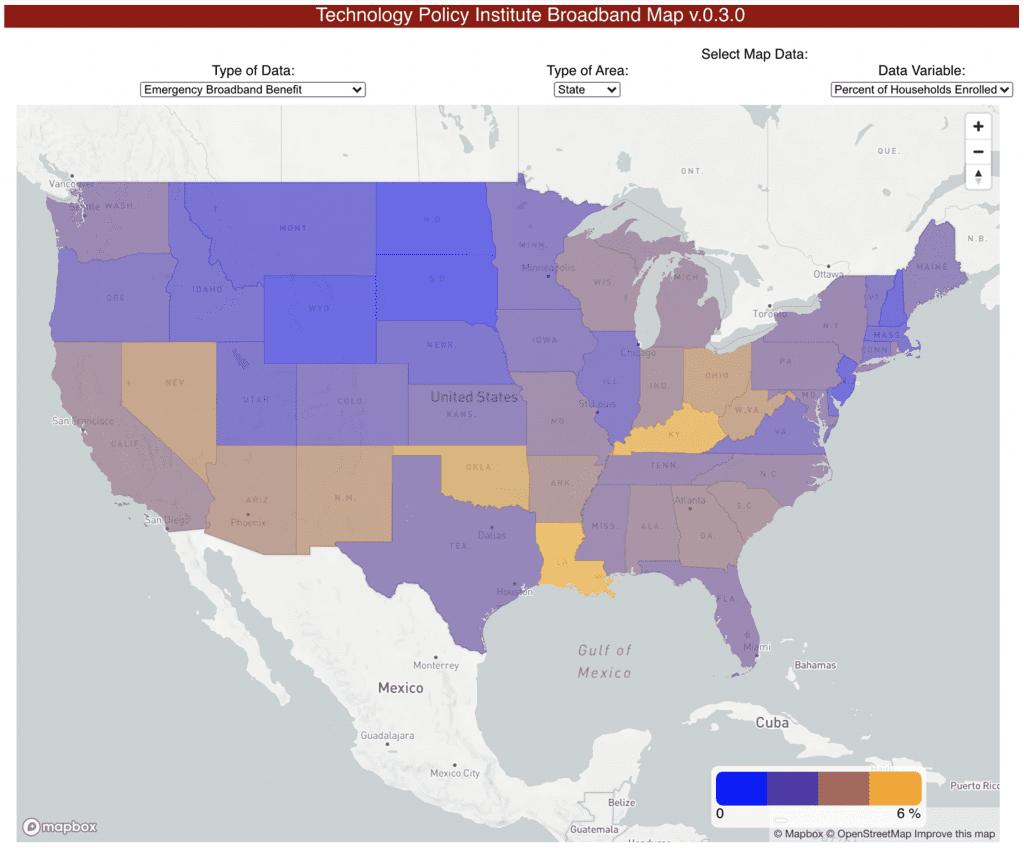
The map shows Louisiana and Kentucky with the largest share of households signing up for the EBB subsidy. Some of the uptake has to do with the relatively low median income levels (and, therefore, more eligible households).
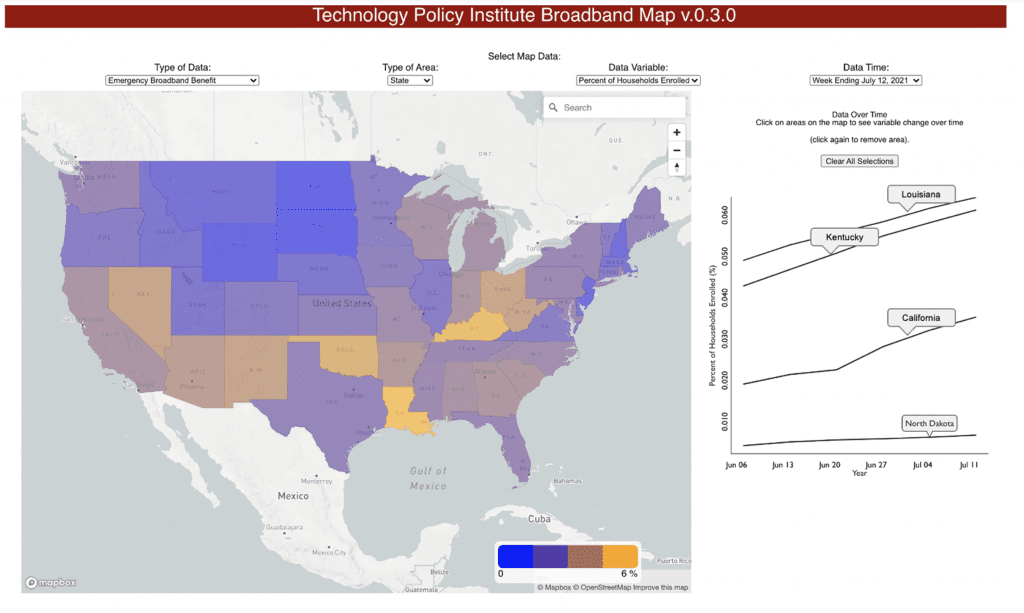
The map below shows changes over time for the top two states, as well as a lagging state, North Dakota, and a middle state, California.
Households in Some Tribal Areas are Enrolling in Relatively Large Numbers
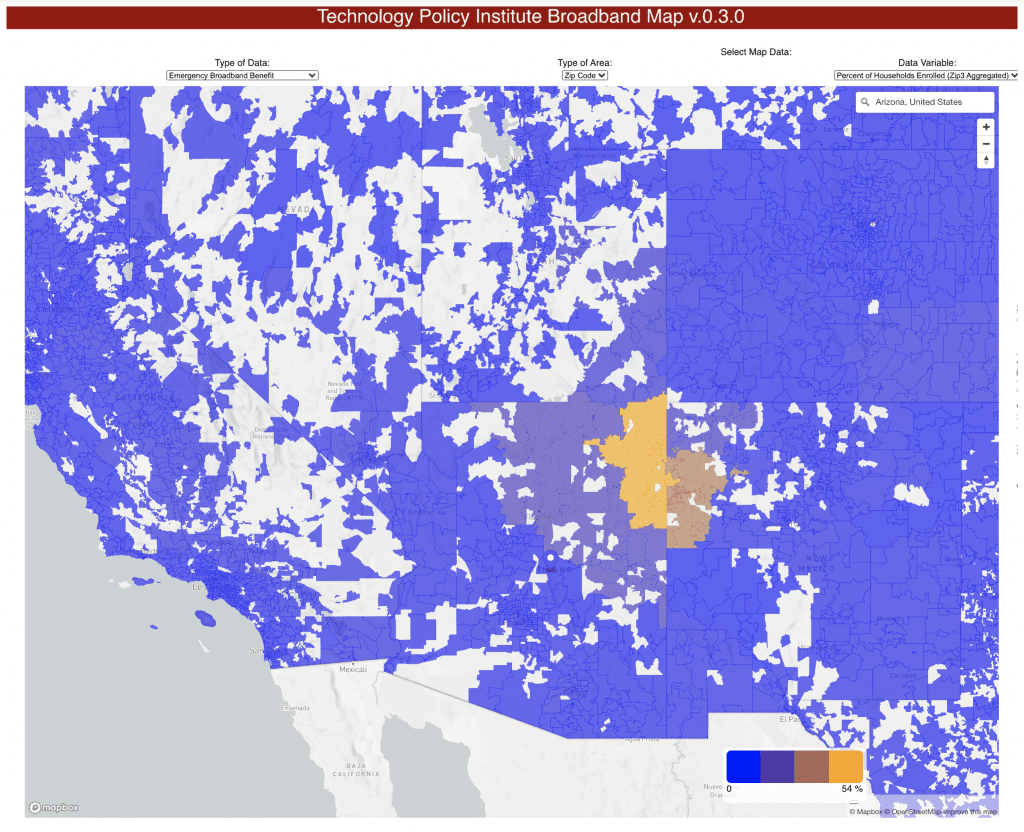
The map suggests that households in some Native American tribal areas are signing up for the program in (relatively) large numbers. The map below, at the ZIP3 geographic level, shows ZIP3 865 in Apache County, most of which is in the Navajo Nation, has the highest signup rate in the country with 54 percent of all households participating in the program by June 29.
In What Areas are Low-Income Households Enrolling?
The share of eligible households that have signed up for EBB by itself provides only limited generalizable information outside of specific areas. A broader question that can be answered statistically is what types of households are generally receiving EBB support. That question is impossible to answer directly as no (public) data on individual households currently exists. We can, however, examine which geographic areas have more and fewer signups as a share of households.
TPI’s Broadband Map makes it possible to examine EBB distribution in several ways.
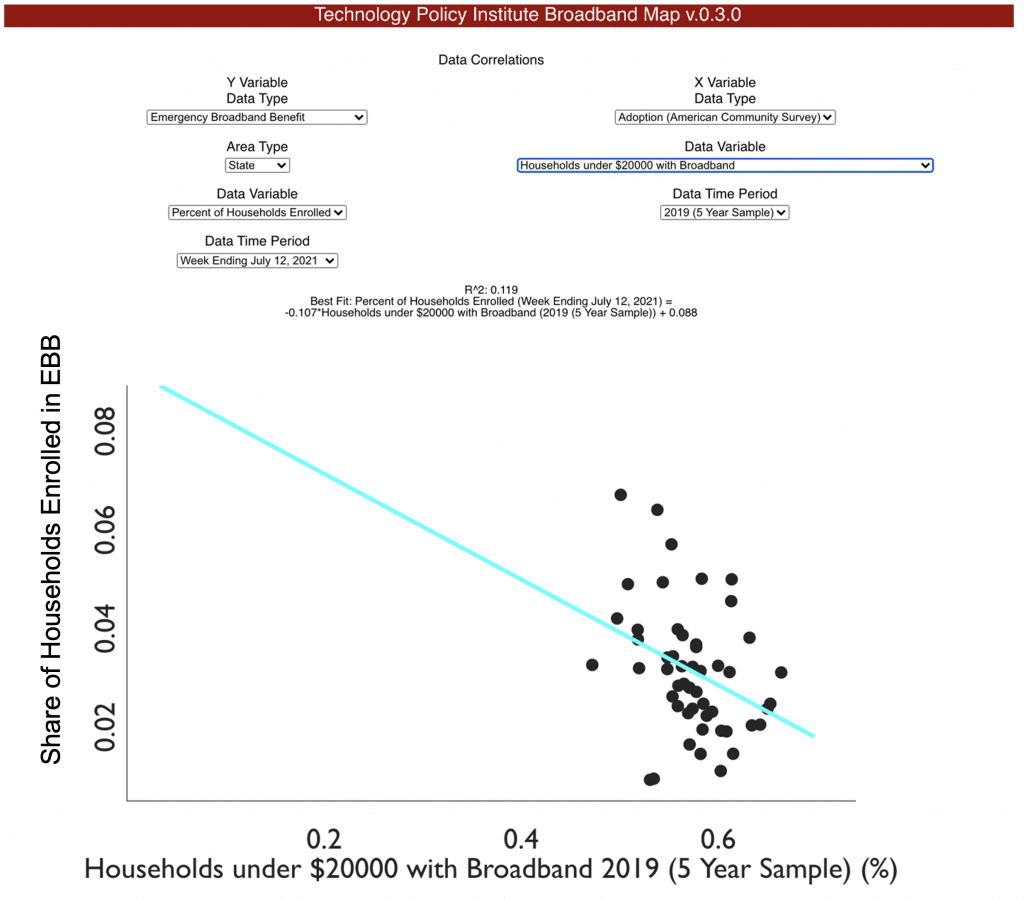
First, we can examine whether there appears to be a correlation between the share of households that have signed up for EBB and the share of very low-income households (those with earnings less than $20,000 per year) with broadband connections. The figure below shows this simple, one-variable regression. This analysis suggests that areas with higher shares of low-income households with broadband are signing up at lower rates than elsewhere. This correlation suggests—but does not prove—that the households who could benefit the most are not the ones primarily benefiting from the program.
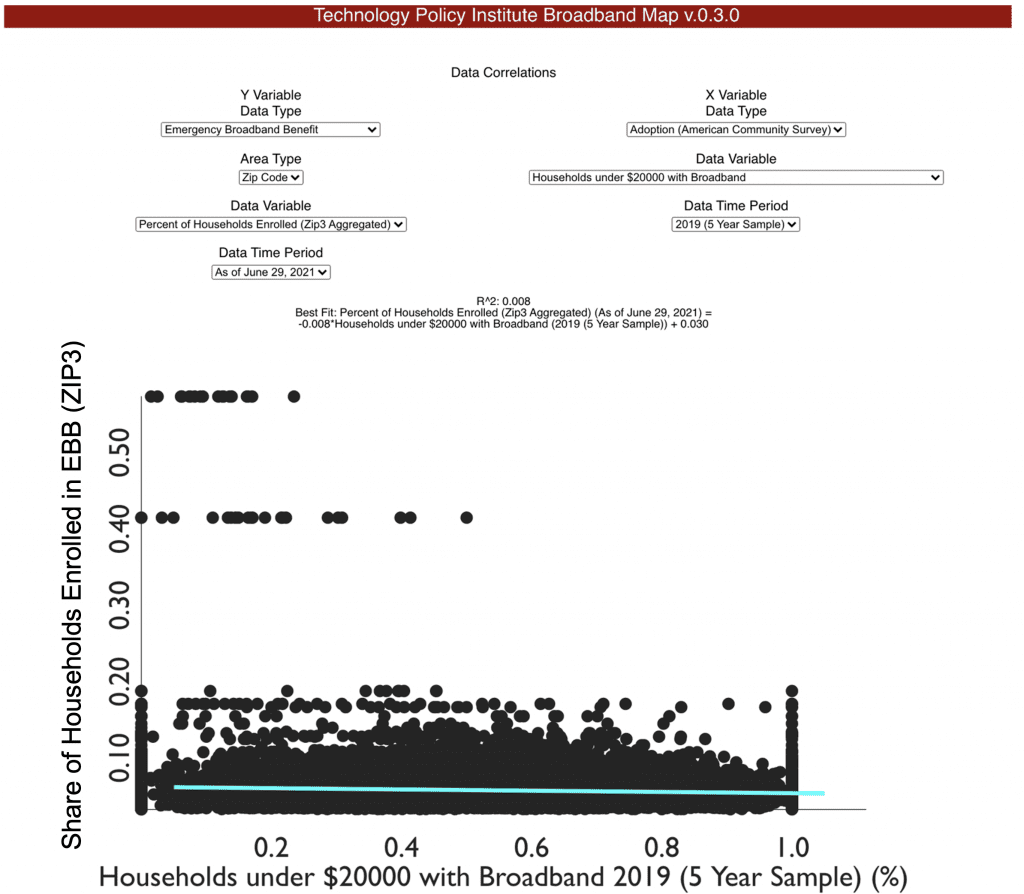
The same analysis at a zip-code level (or, more accurately, ZIP3, since that is the most disaggregated level at which USAC releases the data), shows a similar result, although the fit is worse and the data is less current because USAC releases data at the ZIP3 level less frequently [do they say why? Or if they wait until they have enough to release? Some explanation would help here for the “less frequently”]. Still, as with the state-level data, we see a negative correlation, though of a smaller magnitude, between the share of households enrolled in EBB and the share of households with less than $20k in income with broadband.
It will be some time before we know how the benefits from the EBB were distributed, although the data so far are somewhat concerning. It is worth tracking closely and, hopefully, collecting and making public more detailed data so that we can learn what is working and what isn’t and apply that knowledge towards future programs.
Would you like to use TPI’s Broadband Map to study the Emergency Broadband Benefit fund and other broadband policy questions? To get access to TPI’s statistical toolkit, please contact [email protected] for beta access! Visit tpireports.com for immediate access to TPI’s other data analysis reports, such as custom E-Rate Intelligence Reports in our Congressional District Series and School and Library Series. Download detailed reports on broadband and E-Rate statistics for tens of thousands of schools and libraries and every congressional district in the United States. Read about TPI’s Broadband Map at tpireports.com and tpireports.com/broadband.
Scott Wallsten is President and Senior Fellow at the Technology Policy Institute and also a senior fellow at the Georgetown Center for Business and Public Policy. He is an economist with expertise in industrial organization and public policy, and his research focuses on competition, regulation, telecommunications, the economics of digitization, and technology policy. He was the economics director for the FCC's National Broadband Plan and has been a lecturer in Stanford University’s public policy program, director of communications policy studies and senior fellow at the Progress & Freedom Foundation, a senior fellow at the AEI – Brookings Joint Center for Regulatory Studies and a resident scholar at the American Enterprise Institute, an economist at The World Bank, a scholar at the Stanford Institute for Economic Policy Research, and a staff economist at the U.S. President’s Council of Economic Advisers. He holds a PhD in economics from Stanford University.


