
It is conventional wisdom that the FCC is ignorant of broadband prices. In 2020, for example, the New America Foundation stated unambiguously that “no government agency collects data on internet prices.” To rectify this problem, the Klobuchar-Clyburn bill directs “the FCC to collect and publicize data on prices charged for broadband service throughout the country.”
There’s just one problem. That claim is incorrect.
Since 2014, the FCC has collected detailed price data on nearly 24,000 broadband plans through its “Urban Rate Survey.” The FCC uses the survey data to “determine the reasonable comparability benchmarks for fixed voice and broadband rates for universal service purposes.” Table 1 shows the number of plans the FCC collected as part of the survey each year by technology.
Year Cable DSL FTTH Fixed
Wireless Other Total
| Year | Cable | DSL | FTTH | Fixed Wireless | Other | Total |
| 2014 | 971 | 663 | 404 | 25 | 42 | 2,105 |
| 2015 | 1,147 | 647 | 250 | 120 | 145 | 2,309 |
| 2016 | 1,439 | 535 | 264 | 313 | 104 | 2,655 |
| 2017 | 865 | 841 | 293 | 222 | 0 | 2,221 |
| 2018 | 1,240 | 750 | 630 | 410 | 0 | 3,030 |
| 2019 | 1,381 | 1,201 | 715 | 253 | 0 | 3,550 |
| 2020 | 1,010 | 2,208 | 1,124 | 205 | 0 | 4,547 |
| 2021 | 1,492 | 892 | 499 | 322 | 0 | 3,205 |
| Total | 9,545 | 7,737 | 4,179 | 1,870 | 291 | 23,622 |
Total 9,545 7,737 4,179 1,870 291 23,622
Table 1: Number of Plans Included in FCC Urban Rate Survey by Year and Technology
The presence of this data and analysis of it yield three conclusions:
Policymakers are not aware of the extent of the data the FCC collects, including, in this case, on broadband prices.
Prices across speed tiers (except the slowest in the group, 10 Mbps down and 1 Mbps up) have decreased, download and upload speeds have increased, and data usage allowances (data caps) have increased.
The FCC could combine the Urban Rate Survey with non-public subscription data from Form 477 to create a quality-adjusted consumer broadband price index.
A Price Index of Available Plans
We can use FCC’s calculated benchmark rates to construct an index of sorts for prices offered for different speed tiers over time. To estimate these rates, the authors conduct a hedonic analysis of the prices in the dataset to determine how much the technology type, download speed, upload speed, and data caps affect prices. They use the coefficient estimates to construct an average for each year. The benchmark rate for each speed tier “is the estimated average monthly rate plus twice the standard deviation of rates for terrestrial fixed broadband service plans with download bandwidths of 10 Mbps or greater, upload bandwidths of 1 Mbps or greater, and meeting or exceeding the minimum monthly usage allowance.”
Figure 1 shows this index, where 1 is the first year the tier appeared in the report.
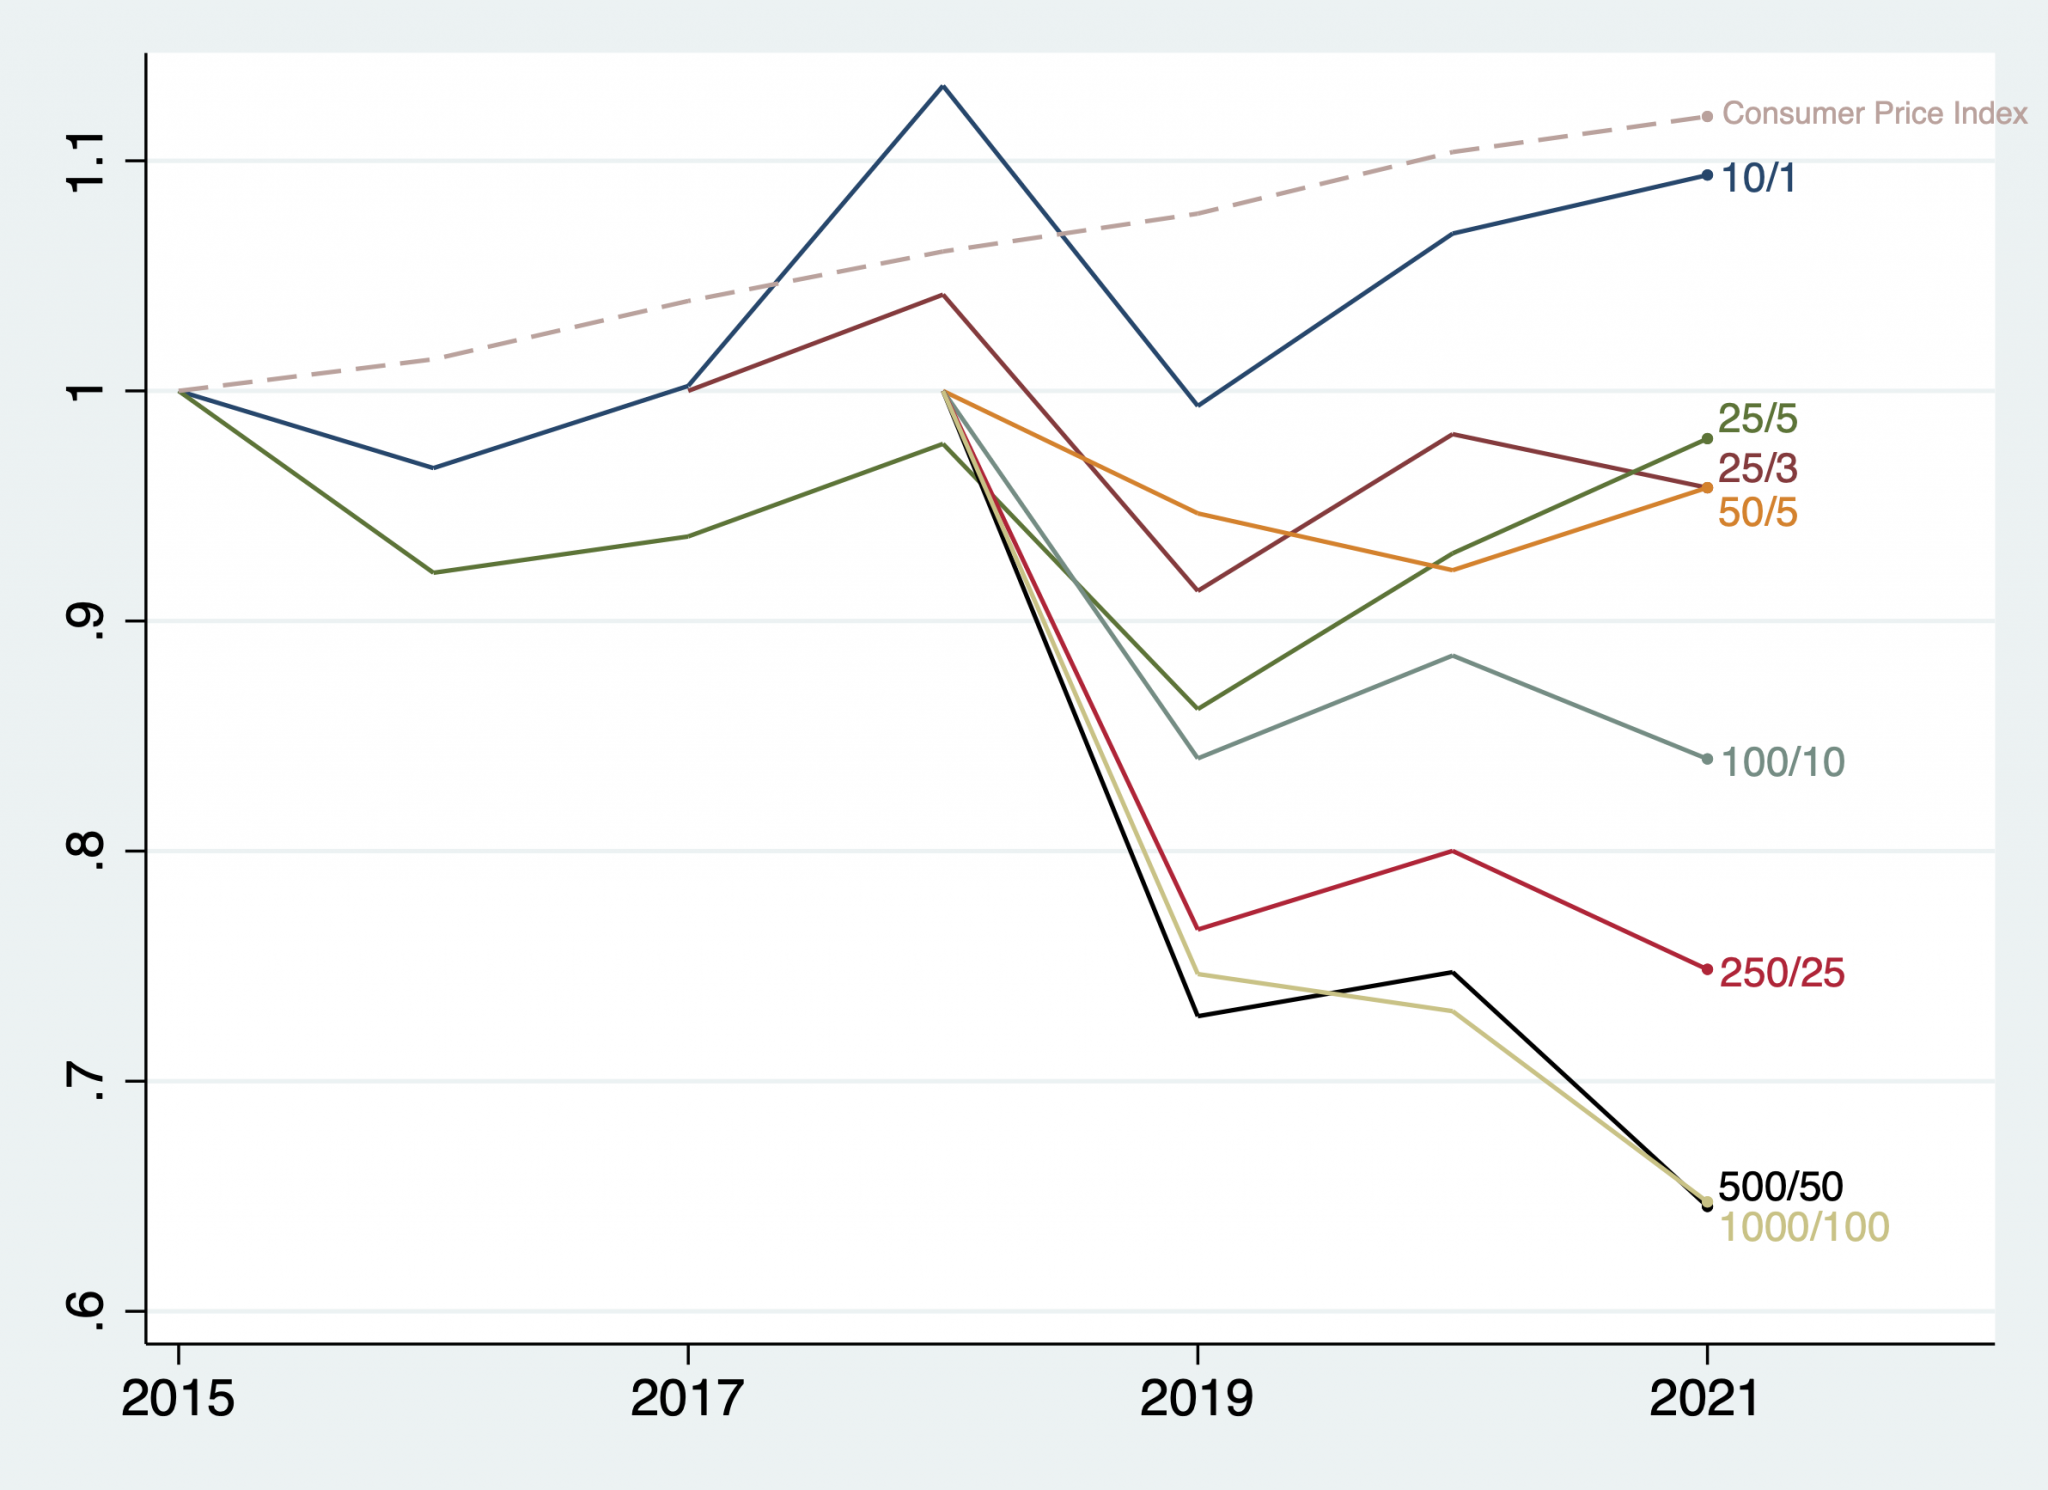
Figure 1: Index Created from FCC’s Benchmark Rates by Tier
The figure shows that the price of the slowest tier in the report, 10Mbps download and 1 Mbps upload, increased from 2015 to 2018, but has come down from its peak. Other prices have fallen, particularly plans offering the fastest speeds. These large decreases are not surprising given that they were more expensive than slower tiers when they were first introduced.
To get a meaningful view of the prices themselves, and how they have changed, it is necessary to use the raw data.
Median Prices, Speeds, and Data Caps
The FCC assigns a weight to each plan in the dataset based on the population of the Census tract in which the plan is offered. The weights are intended to ensure that plans offered to the most people receive the highest weights. Even with the weights, though, it is not always possible to directly calculate a representative price of every technology-speed tier available in the market. While the dataset includes thousands of plans each year, ISPs do not all offer exactly the same download/upload/data cap combinations, and even any given provider may not offer all the same combinations across years. So, for example, while the data includes 3,030 plans in 2018, only five offered exactly 25 Mbps down and 3 Mbps up.
I thus look at the data several different ways.
Figure 2 shows the median, 75th percentile, and 25th percentile of monthly price by download speed. I increase the sample size by defining each download speed as including any download speed within 20 percent of the reference number. So, for example, the “100 Mbps” group includes any plan that offers at least 80 Mbps and not more than 120 Mbps download bandwidth. The figure shows a general downward trend in these prices, except, possibly, the gigabit group, which increased from 2014-2017, but has drifted down since then.
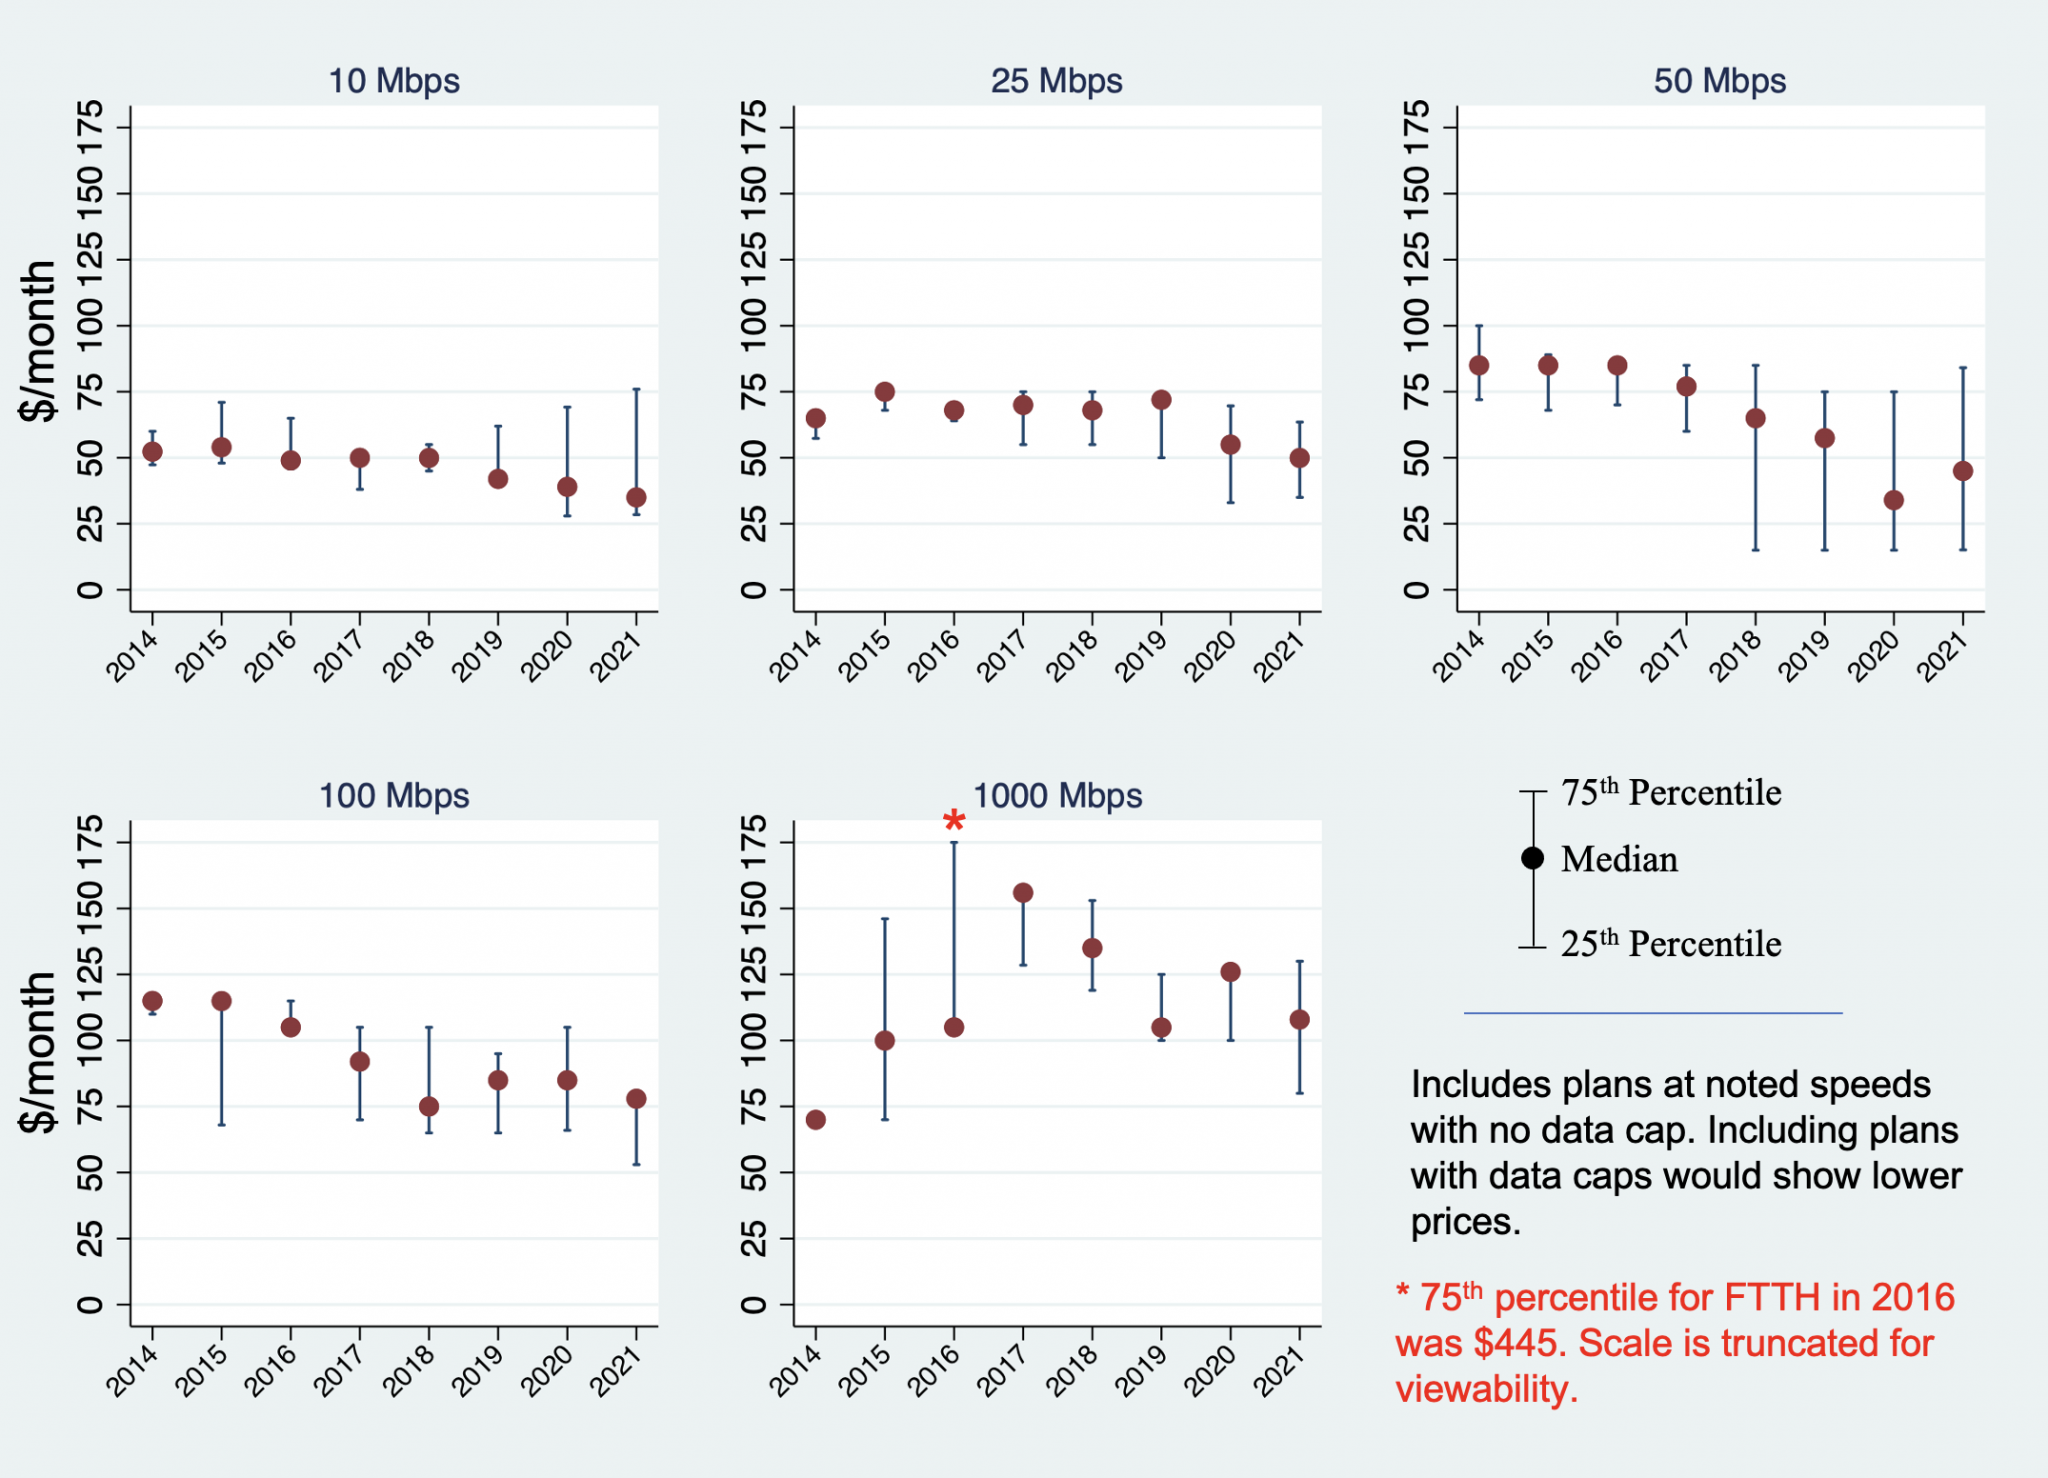
Figure 2: Broadband Prices by Download Mbps 2014-2021
Figure 3 shows 25th percentile, median, and 75th percentile of prices and speeds, as well as the minimum price in the data, from 2014 through 2021. During this time period, the median monthly price increased somewhat from $70 to $80 per month, the lowest price remained fairly constant at around $15 per month, available download speed increased significantly, and upload speeds increased modestly.
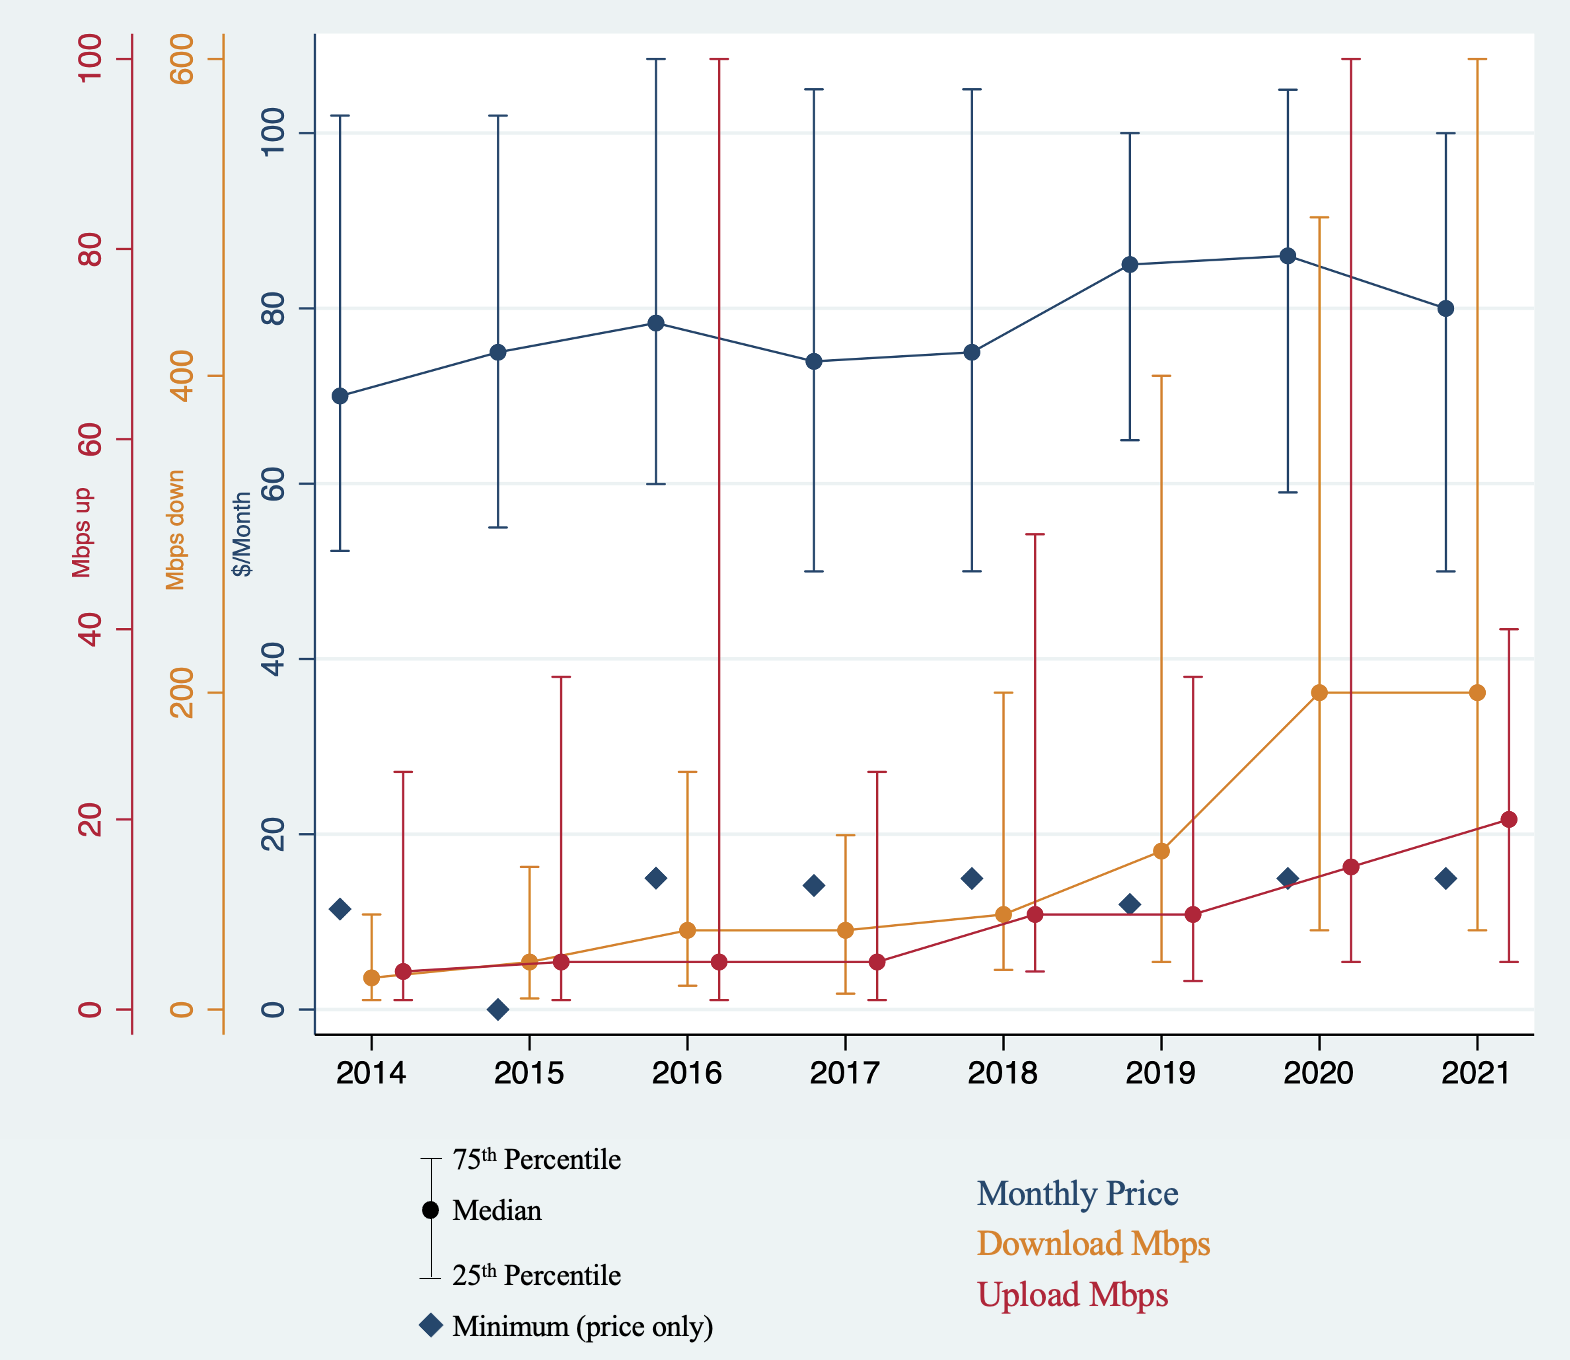
Figure 2: Price and Speed of Plans with No Data Cap, 2014 – 2021
The dataset includes information on data usage allowances (data caps). The distributions shifting to the right over time demonstrate a steady increase in the amount of data typically included in plans with data caps.
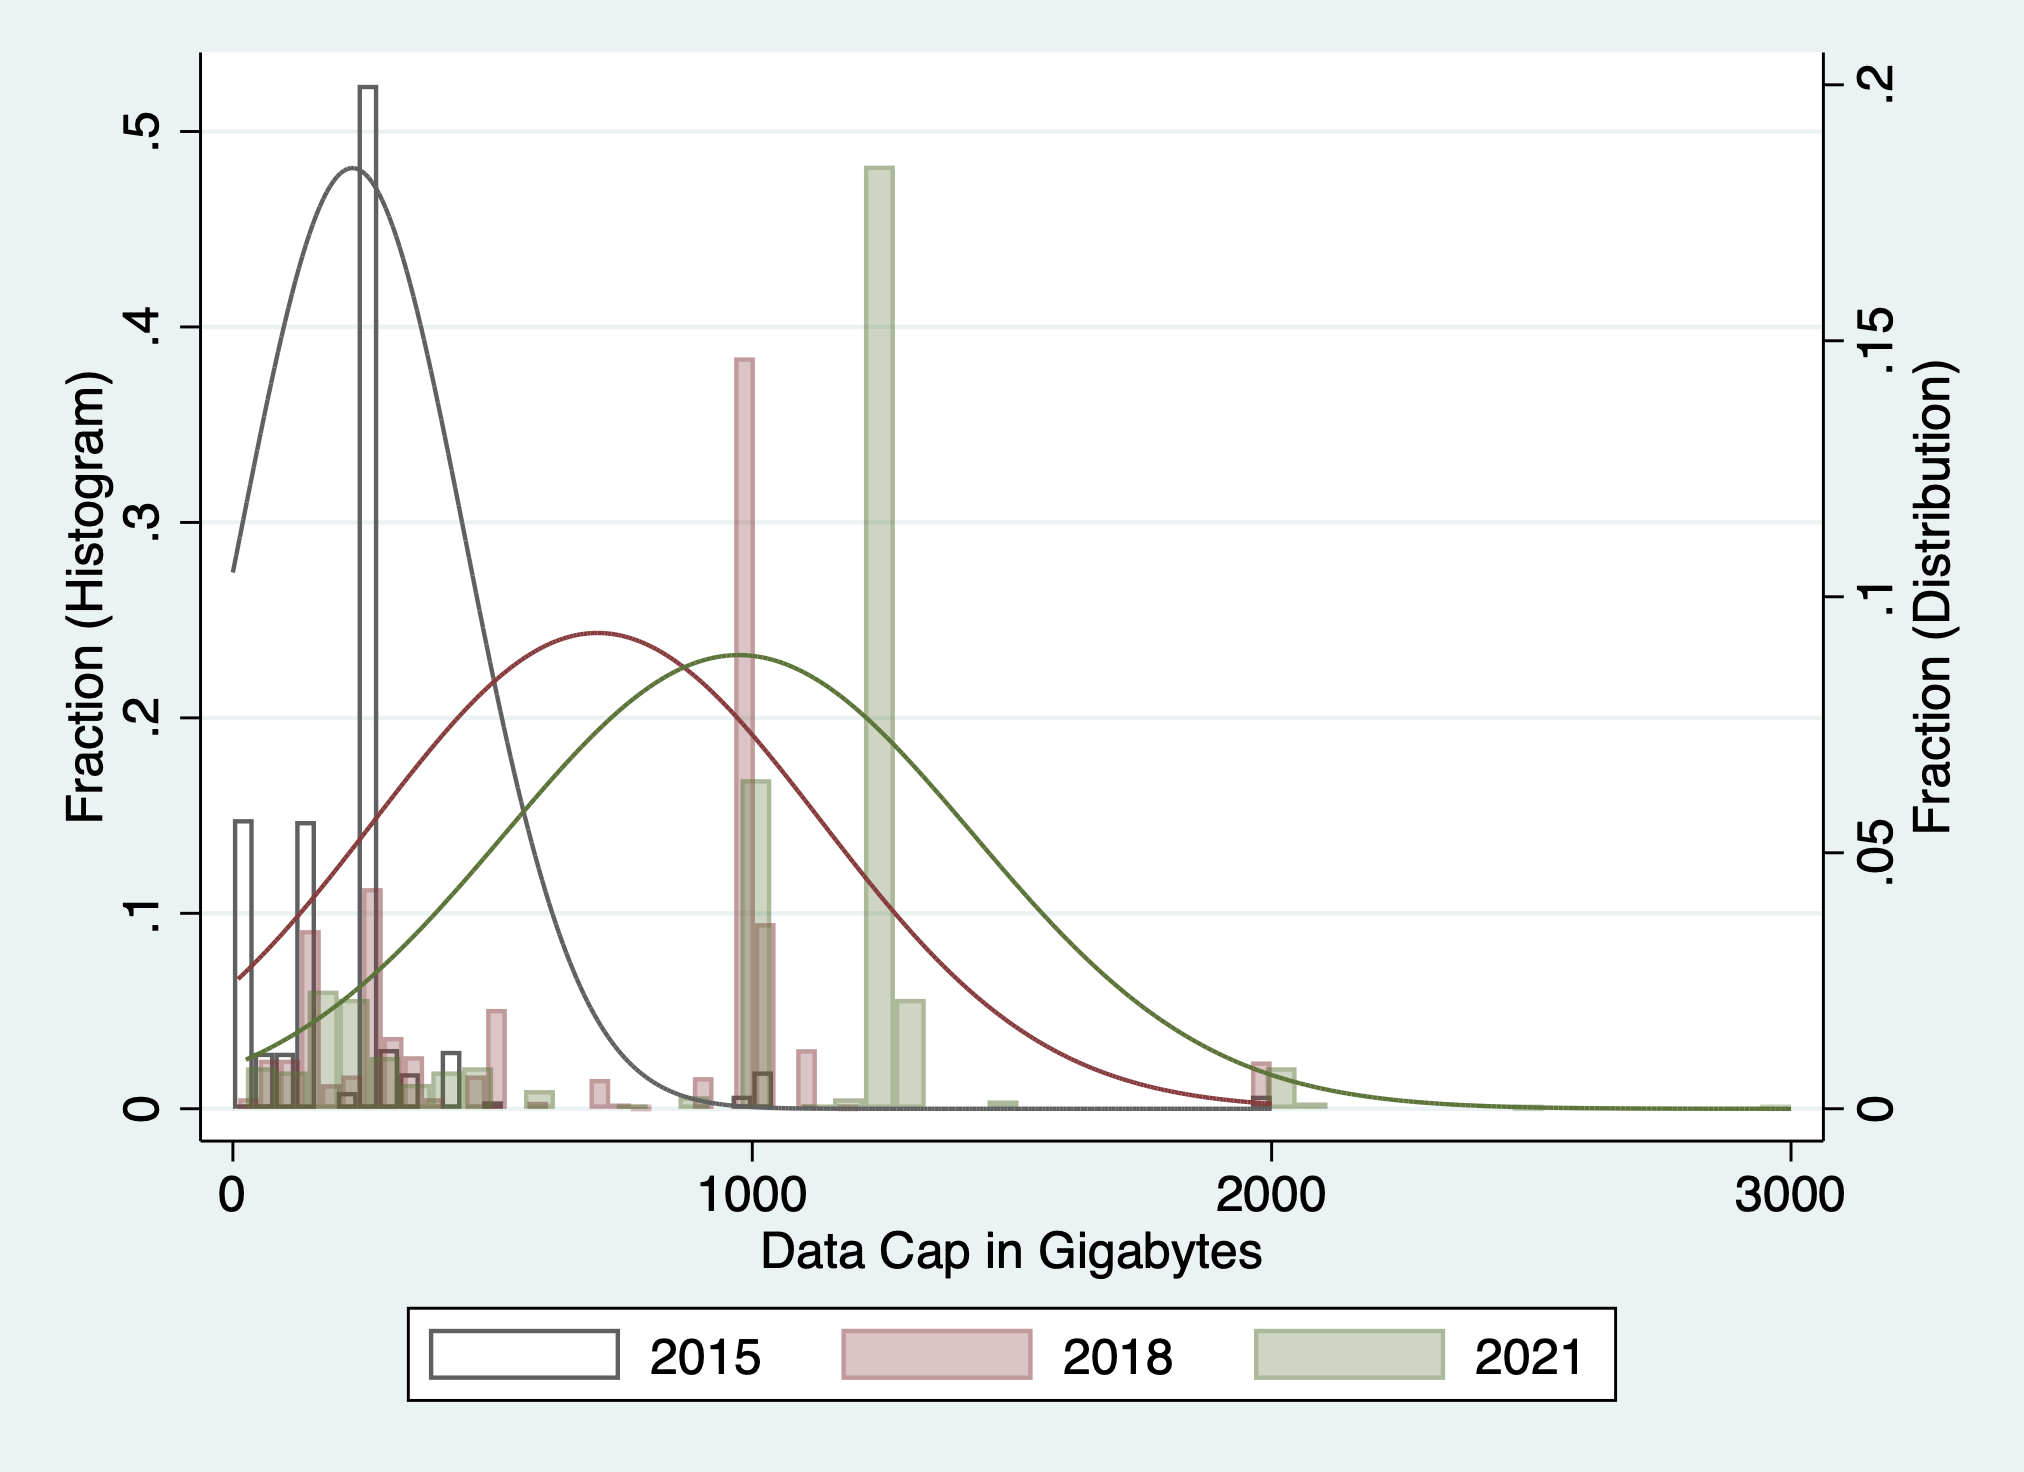
Figure 4: Data Caps Over Time
Note: These histograms exclude all unlimited plans, and set the maximum cap at 3,000 Gigabytes for readability.
True Price Indices Also Require Number of Subscriptions, Which the FCC Collects
The Urban Rate Survey includes data for available plans. The dataset does not tell us how many people subscribe to each plan. We can therefore calculate prices and change in prices for plans in the market and be reasonably confident they are representative of prices consumers would pay if they subscribed to those plans. We cannot say what consumers pay, on average, across plans. The median price of available plans is not necessarily the median price consumers pay because consumers may disproportionately choose particular plans. The availability of a gigabit plan does not mean that many consumers necessarily purchase it. In other words, the distribution of what consumers actually pay overall may not mirror the distribution of plans available. Several studies of prices err by implicitly assuming the distribution of available plans is identical to the distribution of the plans people choose.
Although data on subscribers to each tier is not publicly available, the FCC has that information. ISPs provide it to the Commission on Form 477. As a result, between the Urban Rate Survey and Form 477, the FCC has all the data it needs to construct true, quality-adjusted price indices.
Before creating an entirely new data gathering regime, as many would like, we should step back and consider the data the FCC already collects, what we can learn from it, and how it could be used in ways that it currently isn’t. With that knowledge, we can consider what additional policy questions need answering that cannot be answered with existing data, and go from there.