
“Social distancing” rules have been key tools for mitigating the spread of COVID-19. Social distancing involves a combination of voluntary and government-imposed restrictions on personal interactions in order to prevent the virus from passing from person to person. In much of the world, and in the United States in particular, restrictions have included closing schools, requiring “non-essential” businesses to close, and asking residents to stay home.
Has social distancing helped stop, or at least slow, the spread of the coronavirus? An econometric analysis of variations in social distancing orders across U.S. states suggests that it has been effective.
The econometric analysis described in this post suggests that, on average,
- Each day a state waited to close non-essential businesses relative to the first coronavirus death was associated with 0.36 additional deaths per million people.
- Each day a state waited to close schools relative to the first death was associated with 0.28 additional deaths per million people.
- Each day a state waited to issue a stay-at-home order relative to the first death was associated with 0.09 additional deaths per million people.
Data
The data in this analysis come from two sources. Data on coronavirus cases, deaths, and geography come from The New York Times Github repository. Data on when states implemented different social distancing measures comes from the Institute for Health Metrics and Evaluation. An observation in the dataset is a state-day.
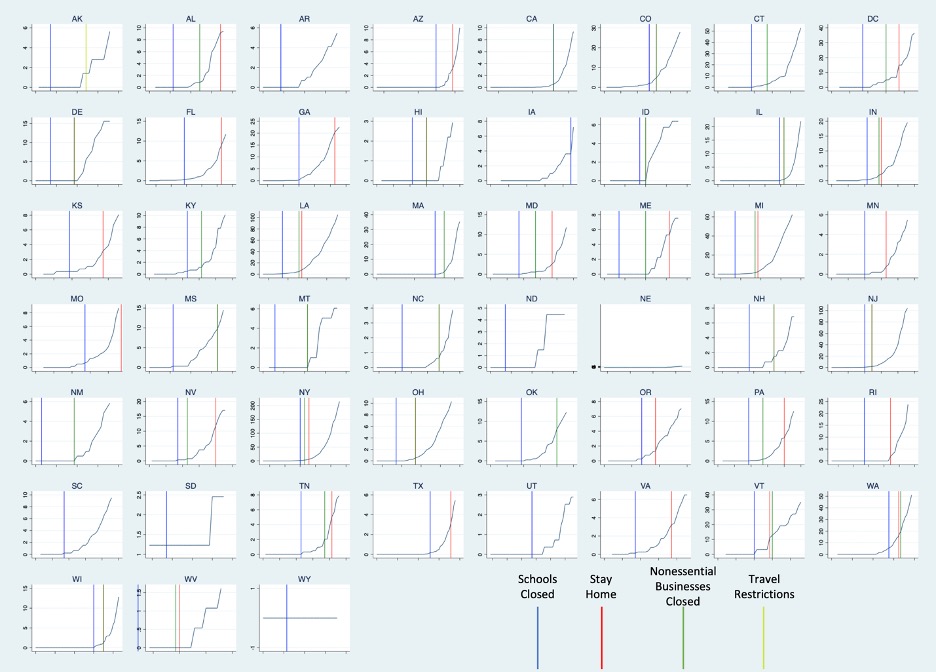
The figure below shows deaths per million people as well as the dates each state closed schools, closed non-essential businesses, and implemented a stay-at-home order.
Number Deaths Per Capita & Social Distancing Rules, Jan 21 – Apr 5, 2020
Empirical Analysis
To estimate the effects of these restrictions I first create variables that measure the number of days between the first death in a state and the date the restriction was imposed. A negative number means the restriction was imposed before the first death, and vice-versa for a positive number. The bigger the positive number, the longer the state waited.
I then estimate the following regression:

Where yit is the number of deaths per million people in state i on day t; Ri is the number of days between imposing the particular restriction and the first death in state i; Zi is a vector of demographic variables for state i, including median age, median income, and population density; and γt are date fixed effects to account for underlying trends and daily changes unrelated to these restrictions.
The table below shows the results of estimating this regression for each of three types of social distancing restrictions. I estimate two sets of regressions: one using cumulative deaths per million people and another using incremental deaths on a given day per million people.
Regression Results: Social Distancing Orders and Deaths Per Capita

The results show that social distancing measures are associated with fewer coronavirus deaths per capita even controlling for median age, median income, population density, and day fixed effects: the earlier governors imposed these restrictions, the fewer deaths per day. The results also suggest, when interpreting the results causally, that closing nonessential businesses had the biggest effect on decreasing deaths, closing schools somewhat less, and stay-at-home orders the smallest effect in terms of magnitude and statistical significance.
Caveats
This analysis suggests that social distancing rules are working. But we should interpret these results carefully.
First, aggregating up to the state level obscures more local differences, both in terms of social distancing orders and deaths. Data on deaths are available at the county level on the New York Times’s Github site, but I have not been able to collect county-level rules.
Second, the social distancing rules are surely endogenous to the number of deaths. That is, the progress of the coronavirus is likely to influence a governor’s decision to implement social distancing rules. We can, however, rule out reverse causality. Reverse causality from these results would imply that the more deaths there were in a state, the longer a governor waited to impose restrictions, which is nonsensical. Still, a fuller analysis would include a first stage that captures the governor’s decisionmaking process.
Third, the coefficients may not always capture the effects of that specific rule, particularly with the stay-at-home order. The regression results suggest that the stay-at-home order made the smallest, if any, difference. It is possible that such orders do not help, but it might also be possible that by the time a governor issues that order, schools and nonessential businesses have already been closed, meaning most people may already staying home as there are so few places to go.
Finally, these estimates are unlikely to be useful in determining how to lift the rules. Presumably, nonlinearities mean that at some point we can lift restrictions without death rates increasing. Or, at least, increasing at a slow enough rate that lifting restrictions makes sense.
Conclusion
State governors have largely been at the forefront of social distancing efforts to mitigate the coronavirus. Some governors acted quickly, others did not. This analysis suggests that social distancing rules mattered and governors who acted quickly saved lives. More work is needed to determine how to lift the restrictions.
Scott Wallsten is President and Senior Fellow at the Technology Policy Institute and also a senior fellow at the Georgetown Center for Business and Public Policy. He is an economist with expertise in industrial organization and public policy, and his research focuses on competition, regulation, telecommunications, the economics of digitization, and technology policy. He was the economics director for the FCC's National Broadband Plan and has been a lecturer in Stanford University’s public policy program, director of communications policy studies and senior fellow at the Progress & Freedom Foundation, a senior fellow at the AEI – Brookings Joint Center for Regulatory Studies and a resident scholar at the American Enterprise Institute, an economist at The World Bank, a scholar at the Stanford Institute for Economic Policy Research, and a staff economist at the U.S. President’s Council of Economic Advisers. He holds a PhD in economics from Stanford University.