

Consumers and policymakers always care about broadband prices. The issue is of particular interest to policymakers now that the Affordable Connectivity Program (ACP) has ended and as states try to figure out what the “affordability” requirements of the BEAD grants mean and how to implement them. Such analysis should begin with an understanding of current prices and how they have changed.
This analysis uses three sources to consider the cost of broadband to consumers: the FCC’s Urban Rate Survey (URS), the U.S. Census Bureau of Labor Statistics (BLS) internet service price index, and the BLS Consumer Expenditures Survey (CES) internet access expenditures.
Each of those sources show a different aspect to measuring broadband prices.
The URS, which is a survey of available plans, shows what is available to consumers who are choosing a broadband service. It does not necessarily reflect what people currently pay, but represents the market people face when choosing plans except that it does not include promotions and discounts. Additionally, it does not include information on how many households subscribe to each plan, so while a weighted average derived from the URS may reflect a measure of a typical available plan, it may not reflect an average of what people actually pay, since some plans are more popular than others.
The BLS price index makes it possible to compare changes in quality-adjusted prices from year to year and to compare them to how other prices have changed as measured by, for example, overall prices as measured by the Consumer Price Index. The index may better represent changes in how much people actually pay and how much they paid in one year relative to others, but it does not reveal prices themselves.
The CES, meanwhile, tells us how much consumers actually spend on the service, thereby incorporating demand. Additionally, the CES includes information on income, making it possible to determine how much people at different income levels spend. The CES, however, also does not have information on which plans people purchase. Thus, expenditures could change due to changes in prices or changes in consumer broadband preferences.
Those three sources together provide a relatively fulsome view of how much broadband costs and how much people spend on it each year.
- Nominal prices for any given speed have been trending downwards for years, but 2023 showed some changes. In 2023, the price of plans offering 25 Mbps and 100 Mbps down continued to decrease, but the prices of plans offering 50 Mbps and, to a lesser extent, 1000 Mbps increased relative to 2022.
- Historically, internet service prices have risen more slowly than overall inflation, sometimes much more slowly. For instance, in 2022, when general inflation (CPI-U) reached 9.1 percent, internet prices only increased by 2.6 percent. The FCC noted that “in real, inflation-adjusted terms, prices for Internet services declined by approximately 19%” between 2009 and 2023. However, internet service prices rose faster than overall inflation from late 2022 to 2024.
- People in the lowest income quartile consistently spend the least on internet access. The latest data is 2022, and until that point do not see significant differences in how expenditures change across income groups.
The remainder of this piece discusses all this information in more detail.
Urban Rate Survey: Prices of Available Plans
The FCC has collected detailed price data annually since 2013 as part of its Urban Rate Survey (URS). The FCC uses the survey data to “determine the reasonable comparability benchmarks for fixed voice and broadband rates for universal service purposes.” The figure below shows the number of plans surveyed by technology type and year.
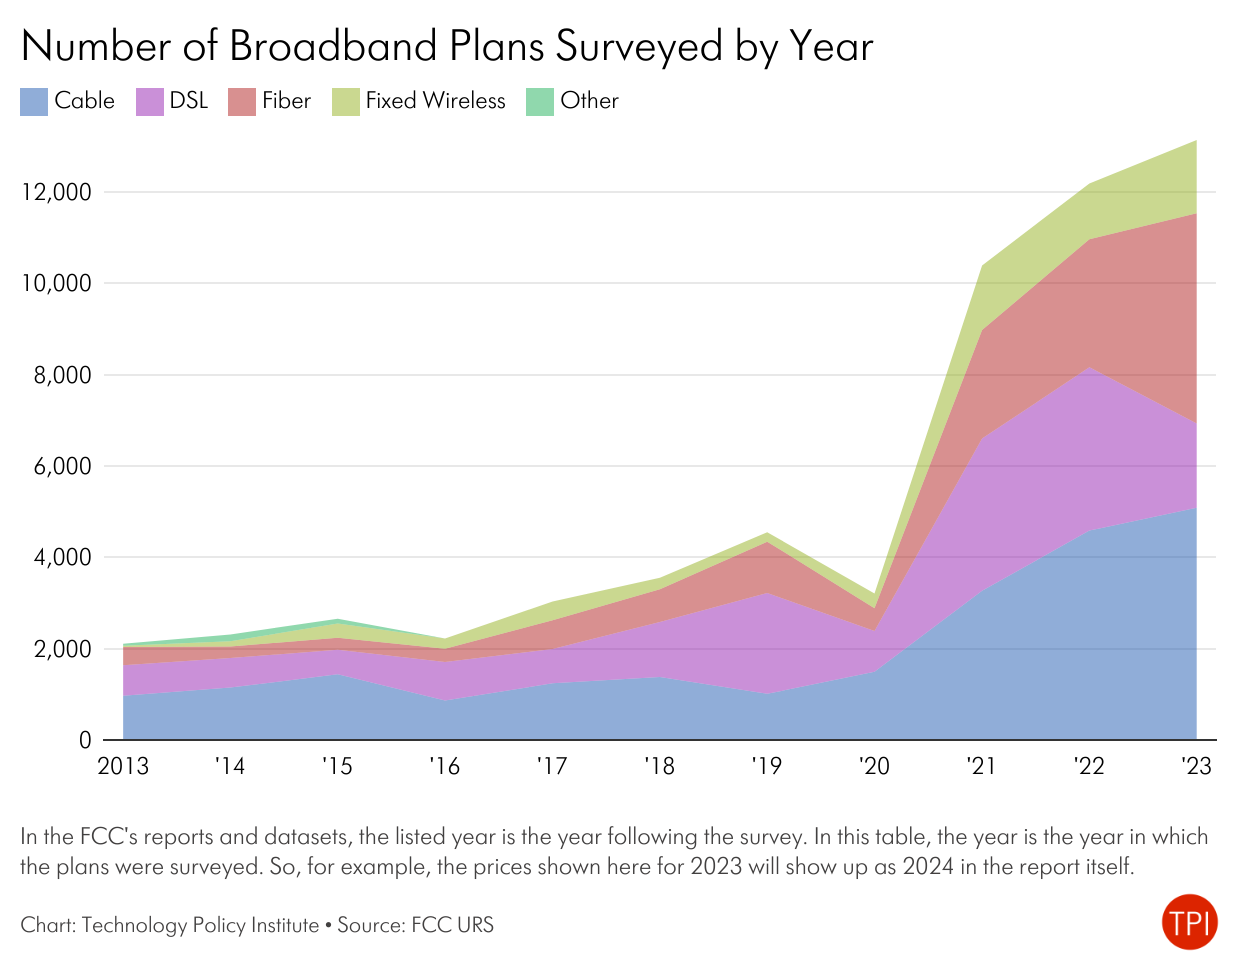
The figure shows that the number of plans the URS includes has grown steadily since the Commission introduced the survey. The survey includes weights so that larger providers contribute more heavily to averages and other analyses than do smaller providers, yielding results that should be nationally representative. The average price levels for each year are likely higher than those most people actually choose among since the data do not incorporate discounts and promotions. However, promotions should not affect trends to the extent promotions stay relatively constant over time.
Comparing plans is not straightforward. Broadband plans differ along a number of dimensions in addition to price, including download speed (bandwidth), upload speed, whether the plan has a data cap and, if so, its size. In the sections below we explore how prices of comparable plans have changed over time. First we compare plans with identical download speeds only, and then we compare plans with identical download and upload seeds.
By Download Bandwidth
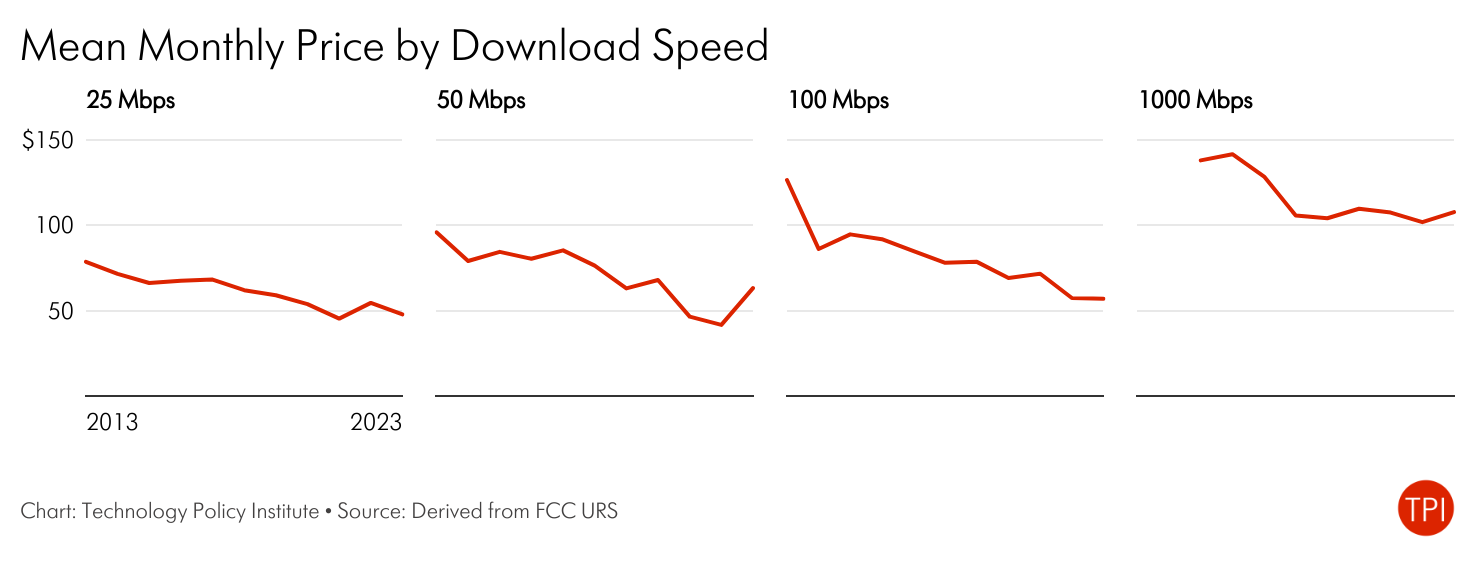
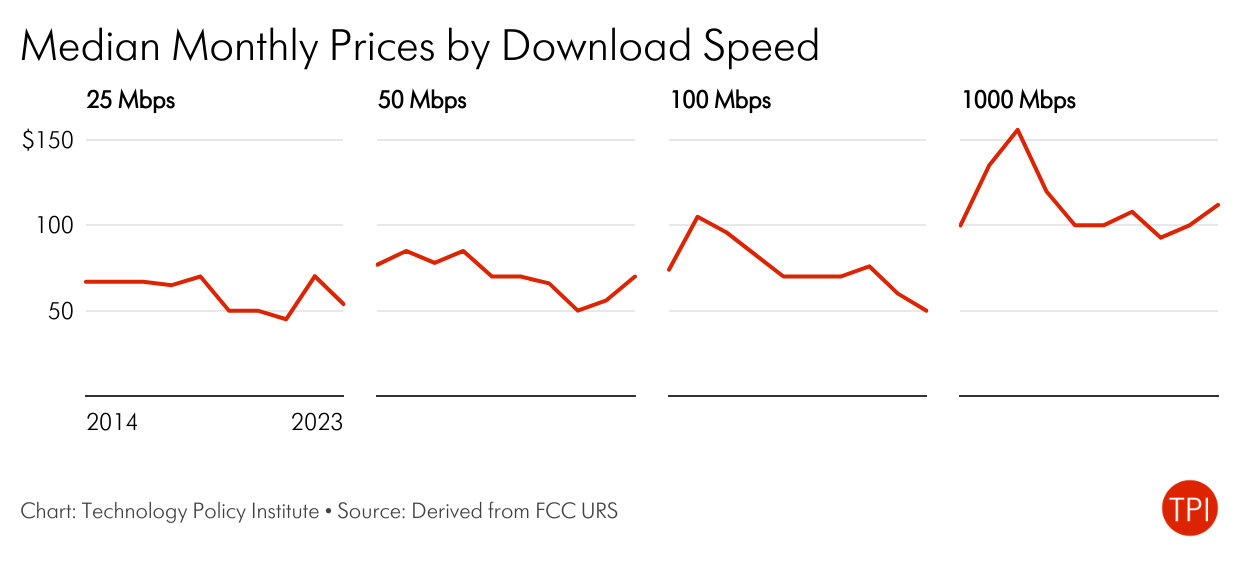
The graph below presents the means and medians of weighted monthly prices by download speed.
Both by mean and median price, plans offering Gigabit download speeds remain the highest priced plans, while the plans for 100, 50 and 25 Mbps cluster together at a lower level. Considering means and medians, plans offering gigabit downloads have hovered between $105 – $110 per month since around 2018. The remaining tiers generally have trended downwards in price. An exception is plans offering 50 Mbps, where prices increased last year.
By Speed Tier
We can show prices at a more granular level by looking at prices of download/upload combinations, which is the way providers advertise plans to consumers. This granularity, however, means each group has fewer observations. For example, 1,072 plans in the 2023 survey offer 1000 Mbps download, but only 546 plans offer 1000/1000 service. The weights included in the survey data help manage this problem somewhat, but presumably the weights indicate the prevalence of the plan overall, not how representative it is of that specific tier, per se.
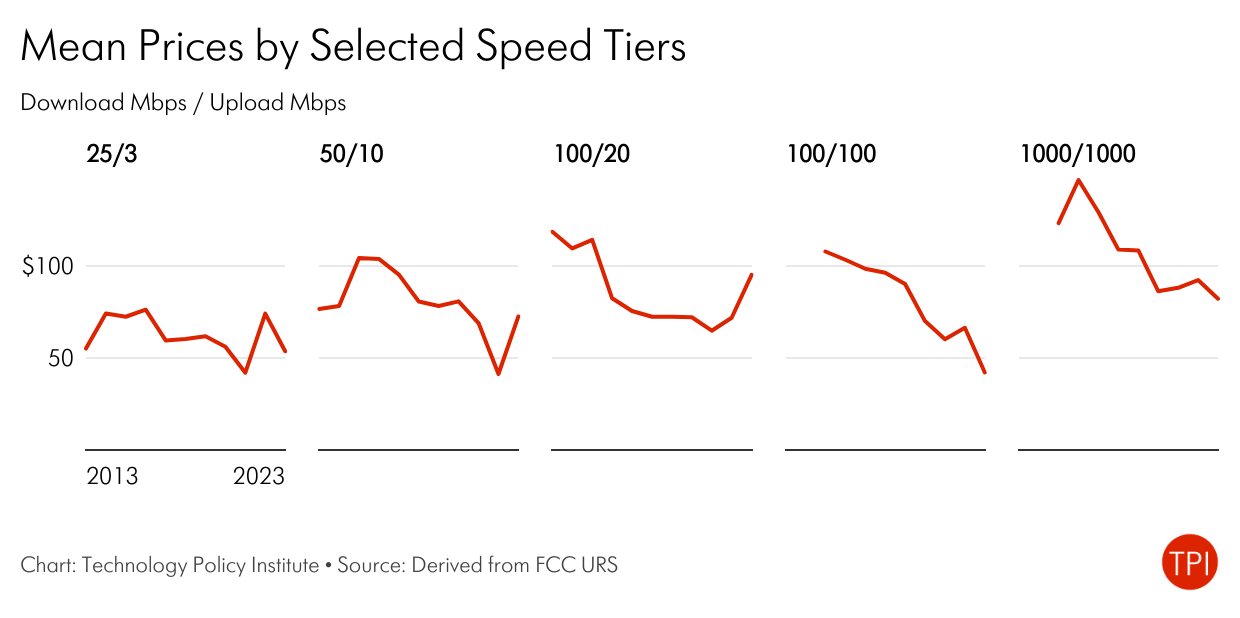
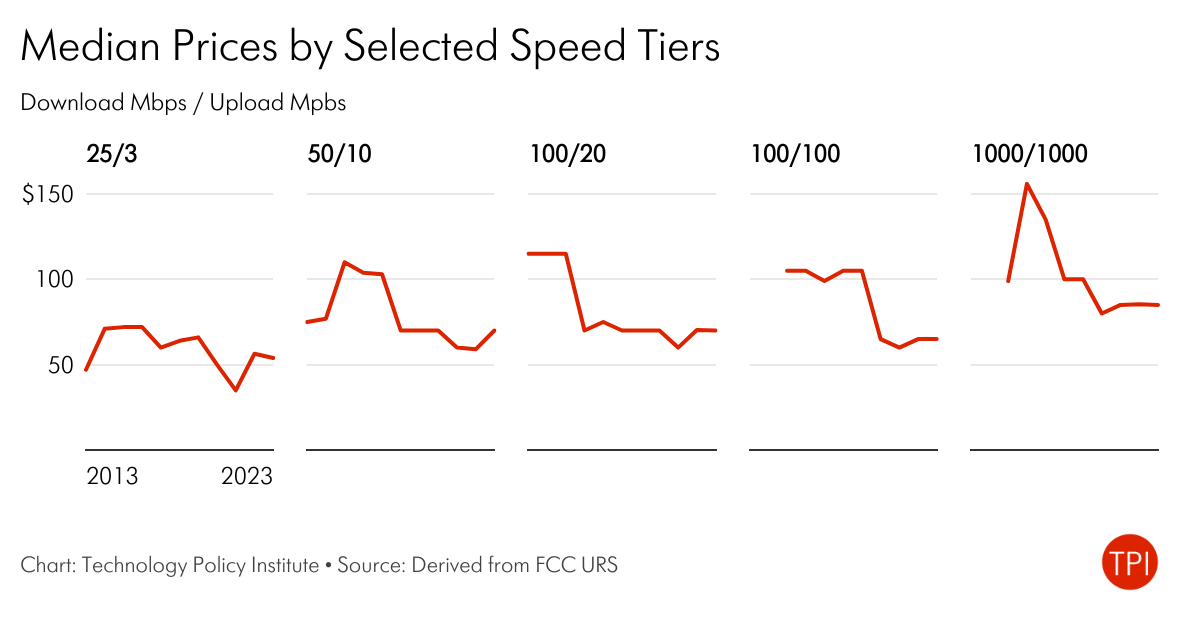
Prices by speed tier show similar trends to those classified only by download speeds.
Internet Price Index
The URS attempts to identify representative broadband plans offered to consumers. It does not, however, include information on how many households subscribe to each plan. That means it is useful for thinking about options available to consumers when they shop, but does not tell us what people tend to choose when faced with these options.
Price indices from the BLS help fill in that gap. Their indices take into account consumer preferences by choosing a representative basket of plans consumers choose. The Figure below shows the BLS Internet price index compared to the overall Consumer Price Index (CPI-U), all set at 2018=100. The figure shows internet service prices mostly increasing at lower rates than overall consumer inflation. However, this trend changed a bit recently, with the Internet price index increasing by about 7.8 percent from June 2022 to June 2024 and the CPI-U increasing by about 6 percent in the same time period, following much larger increases in the CPI-U relative to the internet price index in the two prior years.

Expenditures
A closely related measure is how much people report spending on connectivity. The CES captures some of the buying habits of American consumers, including detailed data on their expenditures, income, and demographic characteristics. These data allow us to focus on household expenditures on internet access, quarterly, from 2016-2022.
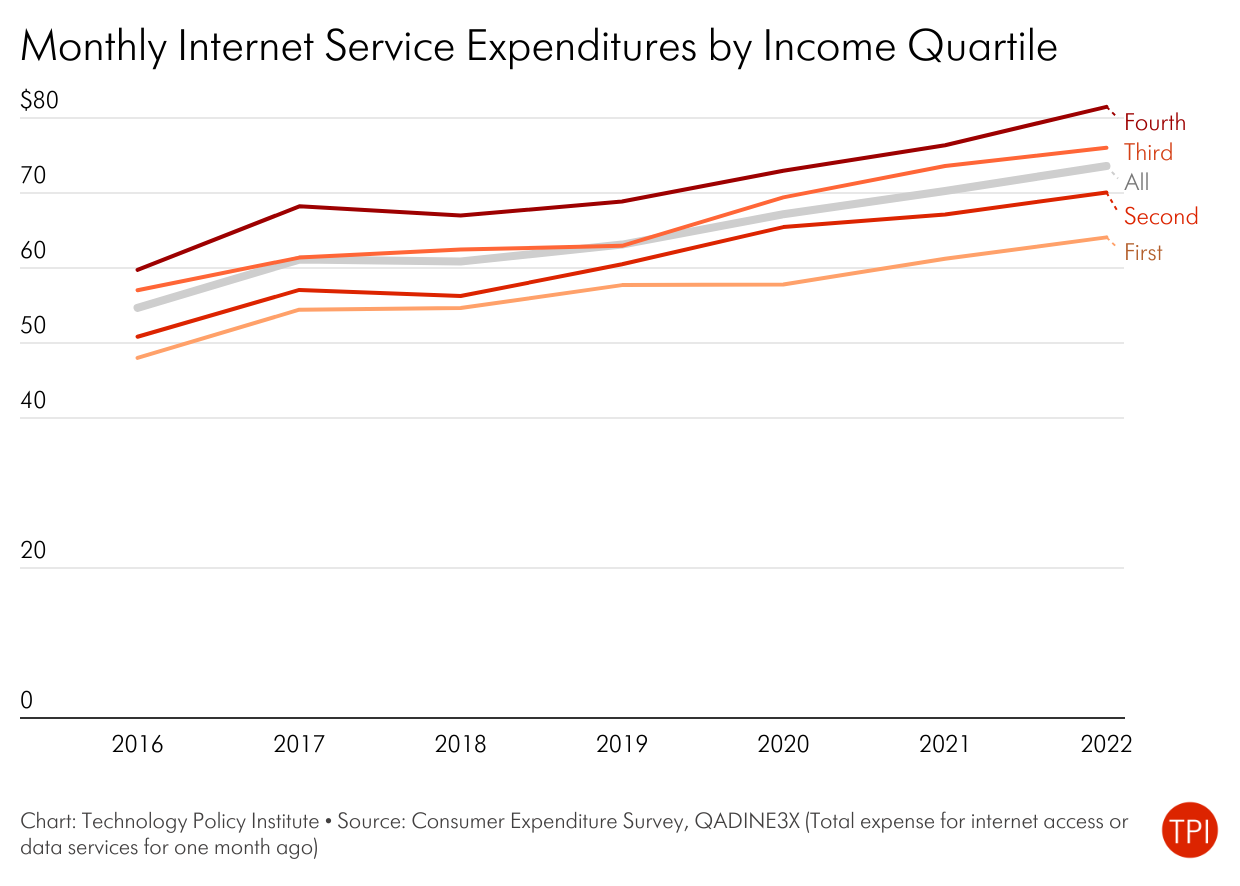
From 2016 to 2022, average household spending on internet services increased from about $54 per month to approximately $74. The increase could reflect changing preferences as people move to higher, more expensive, tiers or price increases that we cannot observe in advertised plans.
We can also break down spending by household income quartiles, which shows households in the highest income quartile consistently spending more on internet access compared to those in lower quartiles. Generally, higher income quartiles spend more on internet access. All quartiles show a gradual increase in spending over the years.
Conclusion
Like many goods and services, broadband prices are complex because they are affected by so many factors, both on the supply and demand sides. The prices of several tiers continue to decrease, but at the same time some have increased, with some evidence that in recent years internet access prices may be increasing faster than inflation. One or two years does not necessarily mean a permanent change in a trend. Indeed, price increases above inflation for the past two years may not be surprising given that overall inflation was about three times as high as that for internet access from 2021 to 2022.
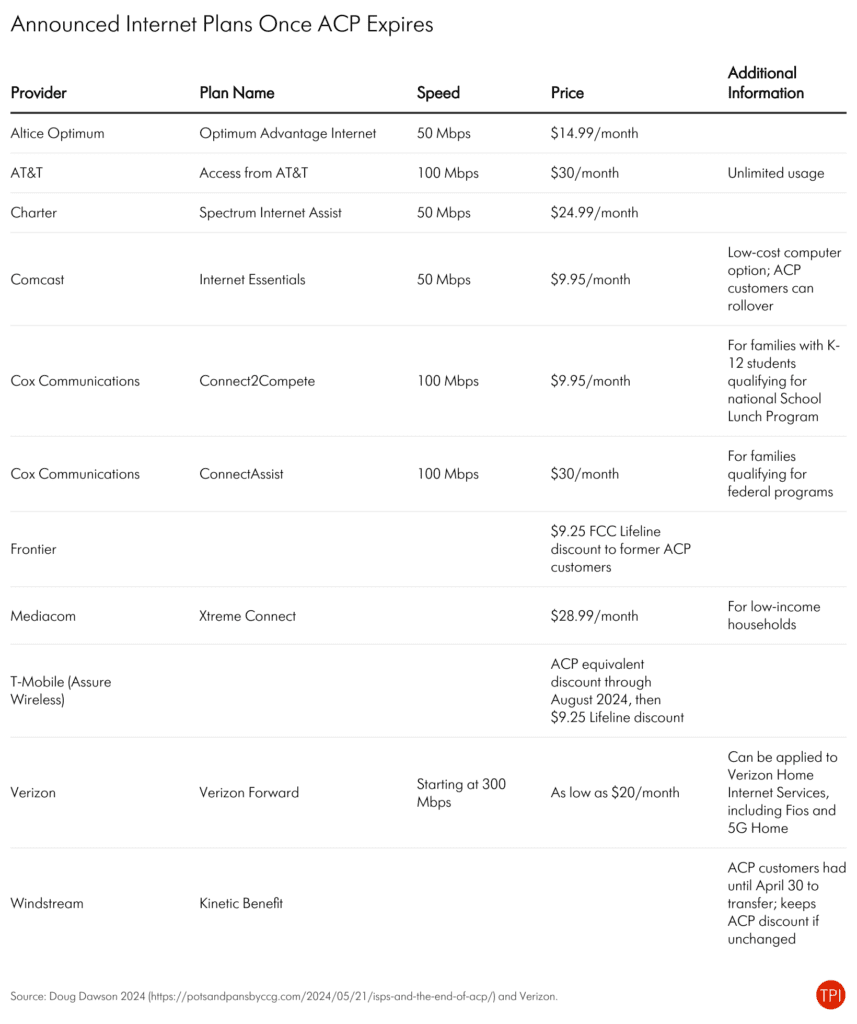
Additionally, with the end of the ACP, many providers have announced lower prices of plans available to low-income consumers. We should expect to see these decreases reflected in future price indices and average prices.
Scott Wallsten is President and Senior Fellow at the Technology Policy Institute and also a senior fellow at the Georgetown Center for Business and Public Policy. He is an economist with expertise in industrial organization and public policy, and his research focuses on competition, regulation, telecommunications, the economics of digitization, and technology policy. He was the economics director for the FCC's National Broadband Plan and has been a lecturer in Stanford University’s public policy program, director of communications policy studies and senior fellow at the Progress & Freedom Foundation, a senior fellow at the AEI – Brookings Joint Center for Regulatory Studies and a resident scholar at the American Enterprise Institute, an economist at The World Bank, a scholar at the Stanford Institute for Economic Policy Research, and a staff economist at the U.S. President’s Council of Economic Advisers. He holds a PhD in economics from Stanford University.