
As Benjamin Franklin famously said, “in this world nothing can be said to be certain, except death, taxes, and tweets by President Trump.” Even after more than 14 months in office, we react like a flock of startled chickens each time another presidential tweet lands with a thud in our midst. The best and brightest among us try to parse meaning from these 140-280 character missives until the next tweet sends us off clucking in surprise once again.
Looking for meaning in any given tweet might be a fool’s errand, but his tweets taken together might provide some information. 538’s Nate Silver, for example, found that more “Twitter rage” was weakly correlated with lower popularity ratings, though the finding was not statistically significant.
Silver may have been looking in the wrong place for meaning in his tweets, though. Rather than thinking about how his tweets affect people’s opinions, it is possible that the causality runs differently, and that Trump’s popularity can be predicted by how people engage with his tweets. In particular, do more “likes” correspond to higher approval ratings?
In short, the answer is yes. Every thousand likes correlates to about 0.02 percent decrease in his disapproval ratings and 0.015 percent increase in his approval ratings. These are meaningful magnitudes given that each tweet accrues about 87,000 likes, on average. To the extent this relationship continues in the future, Twitter may provide a tool for knowing Trump’s approval in something closer to real time than traditional polls provide.
Data
The Trump Twitter Archive records information about Trump’s tweets, including the date and time, device type sending the tweet, number of retweets, number of likes, whether the tweet is itself a retweet, and the content of the tweet itself. Data on Trump’s popularity comes from UCSB’s “American Presidency Project,” which archives Gallup poll results.
Combining the data requires matching tweets to the time period covered in the polling data. For example, the data report an approval rating of 38 percent for the period January 8-14, 2018. However, the president tweeted 45 times, not including retweets, during that time. Thus, an observation in the final dataset is the time period dictated by the polling data. I normalize the tweet data by dividing likes and retweets by the number of tweets in that time period.
The table below shows summary statistics for the dataset.
Table 1: Summary Statistics
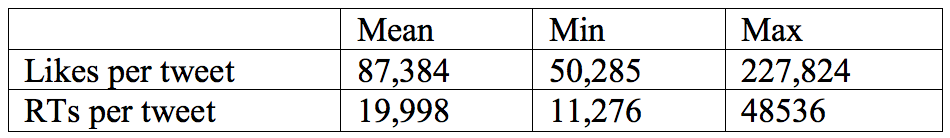 Note: Excludes tweets that Trump retweeted.
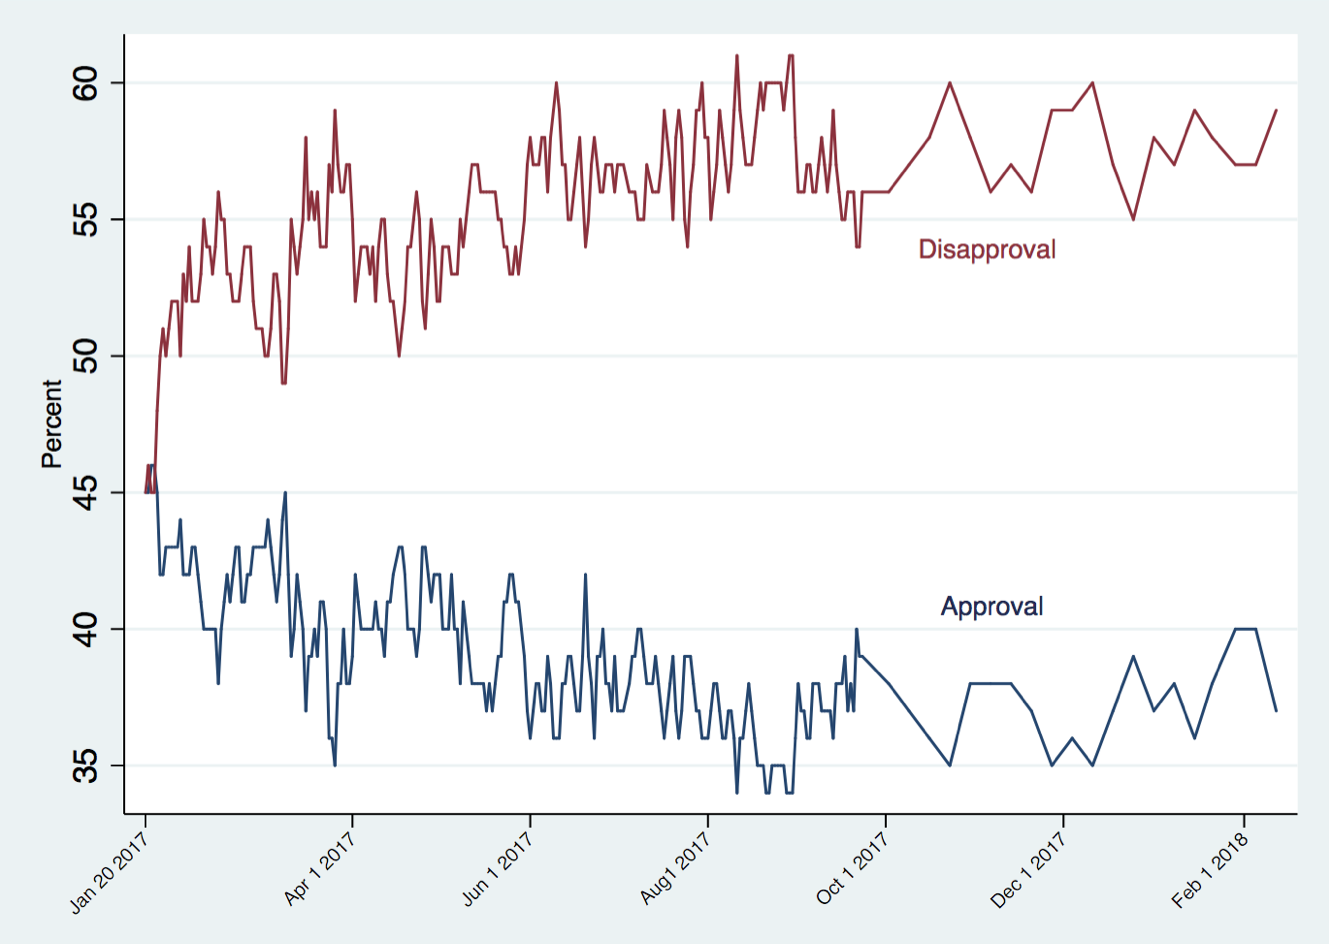
Figure 1 shows the average number of likes and retweets. Figure 2 shows Trump’s approval and disapproval ratings as measured by Gallup.
Figure 1: Likes and Retweets per Tweet from Jan 20, 2017 – Feb 18, 2018
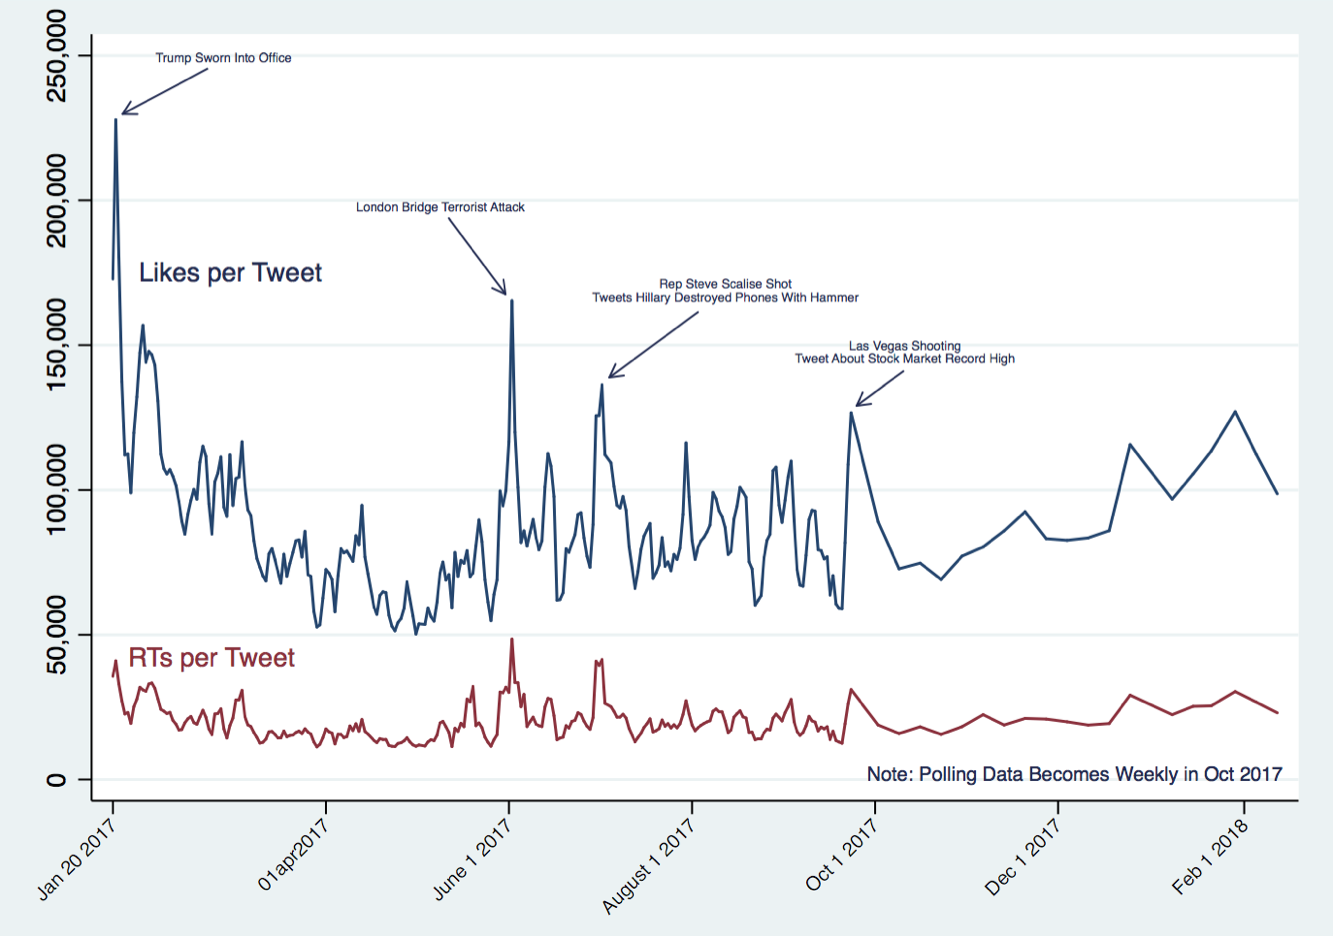
Figure 2: Trump Approval and Disapproval Ratings
Do Likes Predict Approval?
Here I test the hypothesis that likes are correlated with approval ratings. It seems a sensible hypothesis: if more people like the president, more people should “like” his tweets.
Figure 3 graphs Trump’s approval ratings and the average number of likes per tweet during the relevant time period. They do appear correlated, though the match is not perfect.
Figure 3: Tweet Likes and Approval

The next step is to explore the relationship econometrically. I regress Trump’s approval ratings, and then his disapproval ratings, on the average number of likes per tweet. The regression also includes a time trend to account for underlying trends unrelated to tweets, month fixed effects to control for exogenous events affecting his popularity, the number of tweets in the time period, and the number of days in the time period.
Table 2 summarizes the results of these regressions (full results in the appendix). The analysis shows a positive relationship between likes and approval, a negative relationship between likes and disapproval, and a negative relationship between likes and percent whose opinion is “unsure.” All are statistically significant, although the relationship between likes and approval is somewhat less robust than the others—statistical significance at conventional levels is sensitive to the specification.
In short, the results show that more likes is associated with higher approval, lower disapproval, and lower “unsure” ratings.
Table 2: Likes and Polling Outcomes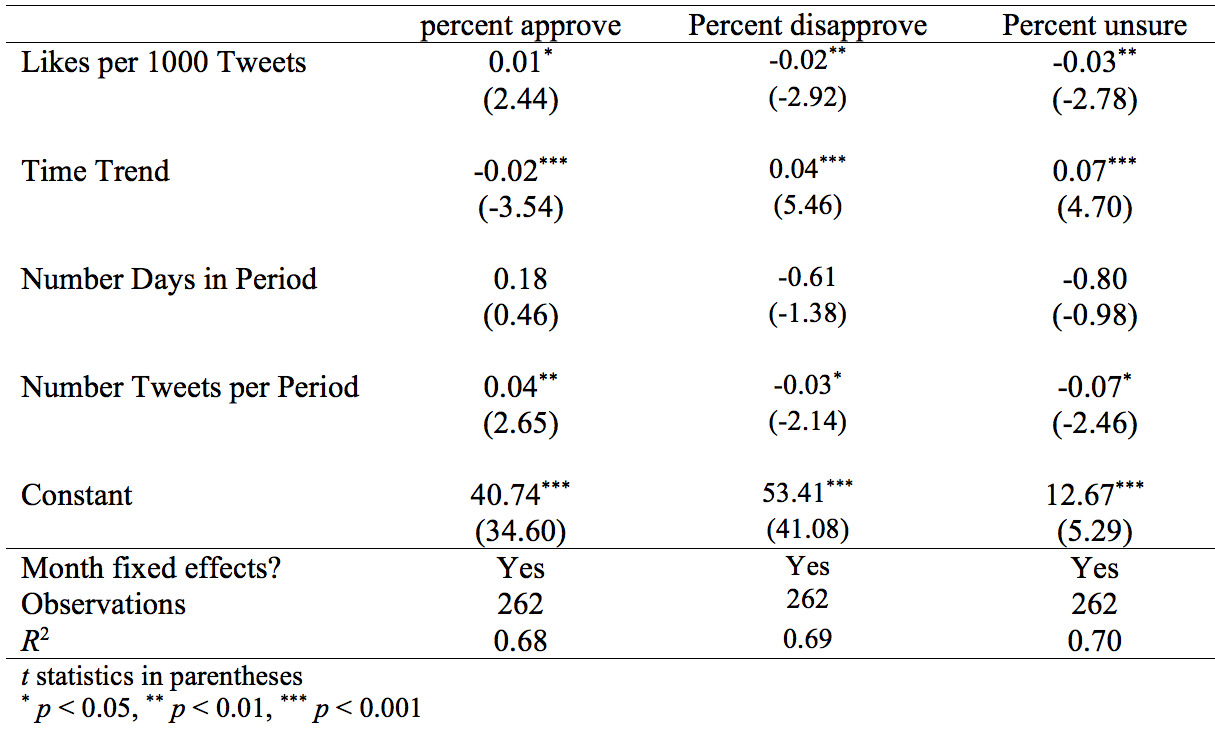
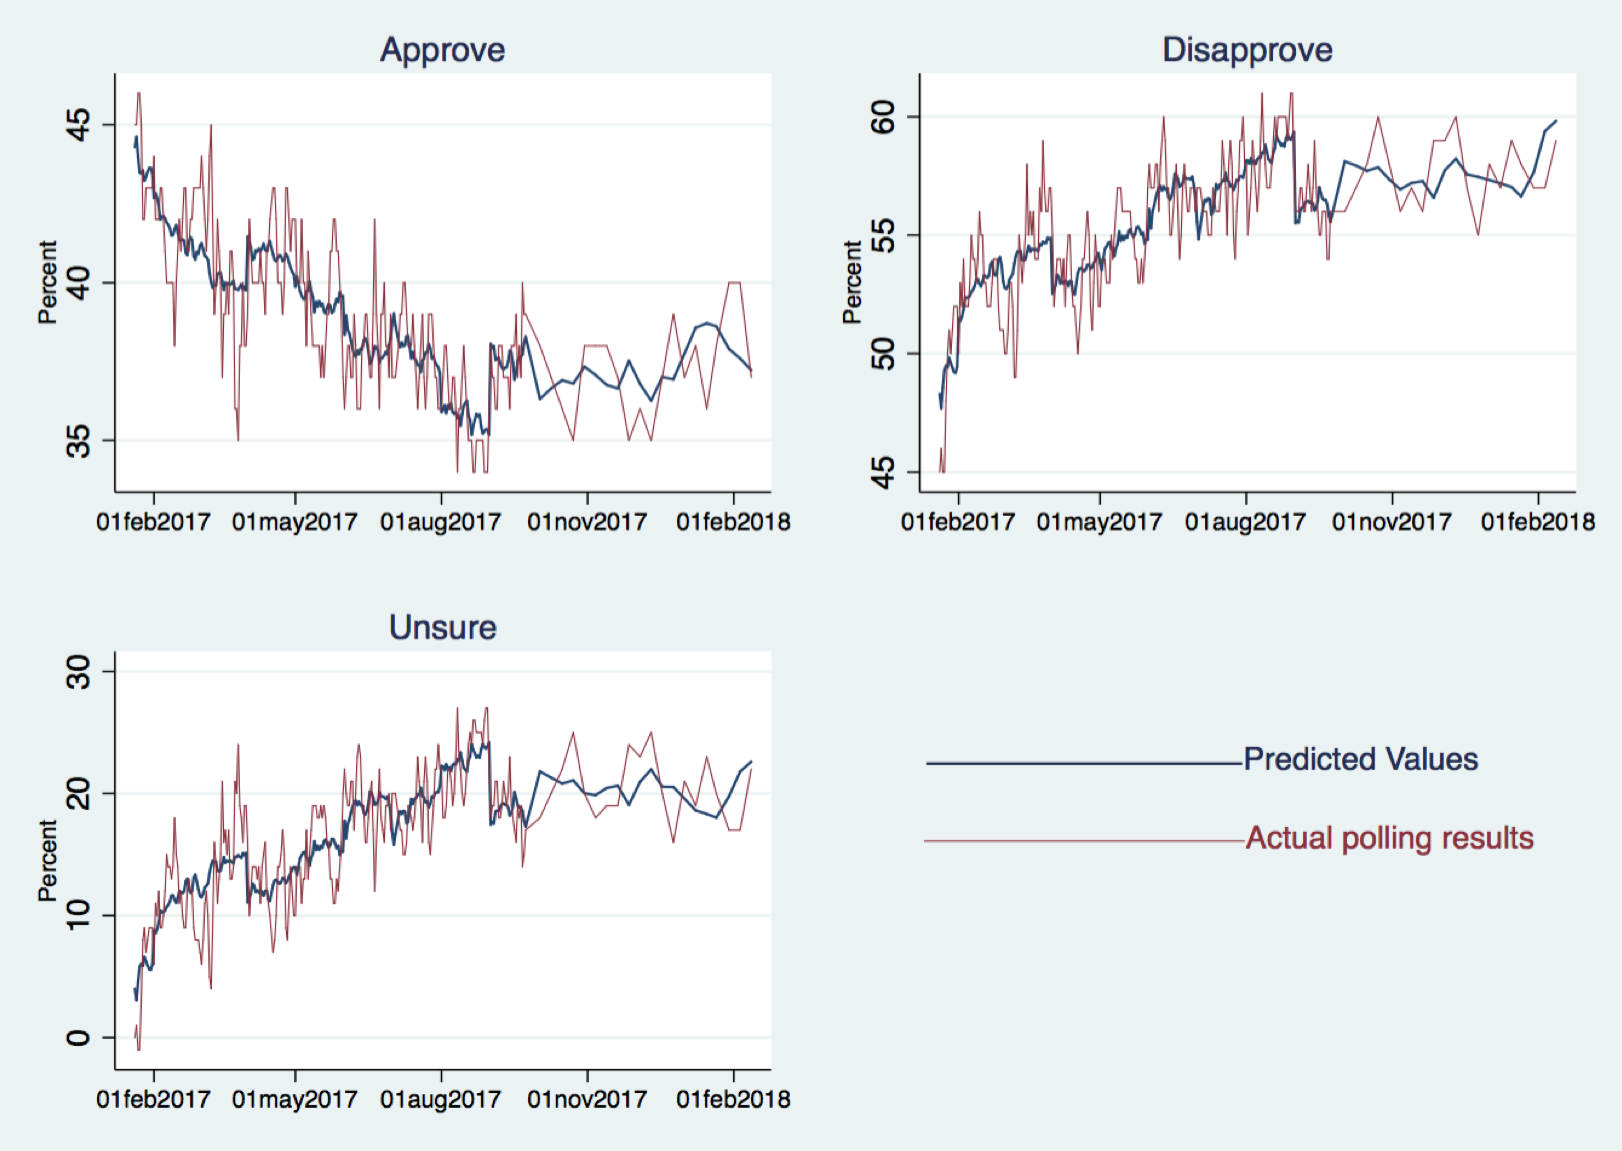
Figure 4 shows the predicted values based on the regression output.
Figure 4: Popularity Ratings Predicted by Regression Model
Implications and Conclusion
Polls are typically conducted over several days, so they report only some average over the days the poll was conducted. Tweets and likes happen in real time. As a result, likes provide a mechanism for determining changes in Trump’s popularity in the present, rather than learning how people felt several days prior.
Of course, this analysis has problems. First, it takes time for likes to accumulate. Presumably they asymptote to their final level for any given tweet over some period of time. To accurately predict popularity based on likes we need to know how quickly the number of likes approaches its final level. Presumably this information is knowable. Second, a large number of other, exogenous, events may affect his popularity in ways that are difficult to know in real time. Finally, the relationship identified here may not persist.
Nevertheless, likes of Trump’s tweets appear to be correlated with his popularity, meaning Twitter provides a tool for evaluating approval ratings in real time.
Appendix
Likes and Approval Ratings
| percent approval | percent approval | percent approval | percent approval | |
| Likes per 1000 Tweets | 0.01* | 0.01 | 0.01 | 0.01* |
| (2.56) | (1.87) | (1.71) | (2.44) | |
| Time Trend | -0.02*** | -0.02*** | -0.02*** | -0.02*** |
| (-16.86) | (-6.85) | (-3.48) | (-3.54) | |
| Number Days in Period | 0.34 | 0.18 | ||
| (0.84) | (0.46) | |||
| Number Tweets per Period | 0.04** | |||
| (2.65) | ||||
| Constant | 41.18*** | 42.26*** | 41.71*** | 40.74*** |
| (84.82) | (45.97) | (36.82) | (34.60) | |
| Month fixed effects? Observations | No 262 | Yes 262 | Yes 262 | Yes 262 |
| R2 | 0.55 | 0.67 | 0.67 | 0.68 |
t statistics in parentheses
* p < 0.05, ** p < 0.01, *** p < 0.001
Likes and Disapproval Ratings
| percent disapproval | percent disapproval | percent disapproval | percent disapproval | |
| Likes per Tweets (1000s) | -0.02** | -0.02** | -0.01* | -0.02** |
| (-3.30) | (-2.66) | (-2.37) | (-2.92) | |
| Time Trend | 0.03*** | 0.03*** | 0.04*** | 0.04*** |
| (15.69) | (9.68) | (5.40) | (5.46) | |
| Number Days in Period | -0.75 | -0.61 | ||
| (-1.69) | (-1.38) | |||
| Number Tweets per Period | -0.03* | |||
| (-2.14) | ||||
| Constant | 53.44*** | 51.32*** | 52.55*** | 53.41*** |
| (95.70) | (50.58) | (42.22) | (41.08) | |
| Month fixed effects? Observations | No 262 | Yes 262 | Yes 262 | Yes 262 |
| R2 | 0.53 | 0.68 | 0.68 | 0.69 |
t statistics in parentheses
* p < 0.05, ** p < 0.01, *** p < 0.001
Likes and “Unsure”
| dk | dk | dk | dk | |
| Likes per 1000 Tweets | -0.03** | -0.03* | -0.02* | -0.03** |
| (-3.05) | (-2.36) | (-2.13) | (-2.78) | |
| Time Trend | 0.05*** | 0.05*** | 0.07*** | 0.07*** |
| (16.76) | (8.62) | (4.63) | (4.70) | |
| Number Days in Period | -1.09 | -0.80 | ||
| (-1.33) | (-0.98) | |||
| Number Tweets per Period | -0.07* | |||
| (-2.46) | ||||
| Constant | 12.26*** | 9.06*** | 10.84*** | 12.67*** |
| (12.12) | (4.84) | (4.71) | (5.29) | |
| Month fixed effects? Observations | No 262 | Yes 262 | Yes 262 | Yes 262 |
| R2 | 0.56 | 0.69 | 0.69 | 0.70 |
t statistics in parentheses
* p < 0.05, ** p < 0.01, *** p < 0.001

Scott Wallsten is President and Senior Fellow at the Technology Policy Institute and also a senior fellow at the Georgetown Center for Business and Public Policy. He is an economist with expertise in industrial organization and public policy, and his research focuses on competition, regulation, telecommunications, the economics of digitization, and technology policy. He was the economics director for the FCC's National Broadband Plan and has been a lecturer in Stanford University’s public policy program, director of communications policy studies and senior fellow at the Progress & Freedom Foundation, a senior fellow at the AEI – Brookings Joint Center for Regulatory Studies and a resident scholar at the American Enterprise Institute, an economist at The World Bank, a scholar at the Stanford Institute for Economic Policy Research, and a staff economist at the U.S. President’s Council of Economic Advisers. He holds a PhD in economics from Stanford University.
