The pandemic has caused the U.S. to take seriously the question of how to make sure all residents have broadband access for remote learning, telehealth, government services, work, job training, and other activities necessary to participate fully in society. Unfortunately, the push to define broadband as a connection capable of running 20 HD Netflix streams simultaneously threatens to thwart the more important objective.
Specifically, the calls to define broadband as a connection offering symmetric, 100 Mbps download and 100 Mbps upload bandwidth (100/100) are arbitrary, with no evidence supporting these numbers. Every application commonly used for key services, as well as popular entertainment streaming services, rely on far less than 100 Mbps. The right way to define broadband is to grade it along a continuum of factors that affect the quality users experience, similar to how the FCC actually already does it in its reverse auctions.
If broadband is defined by having a connection of at least 100/100, then only about 42% of households has access to broadband (Figure 1). At the end of this post, we also show the percentage of the population of each state would be considered “served” under the old and proposed definitions.
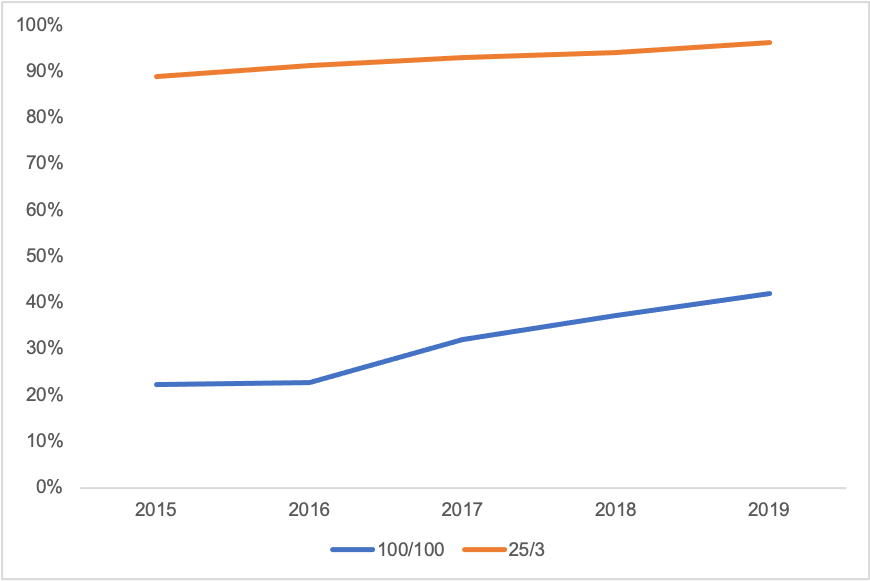
Figure 1: Share of Households with Access to Different Speed Thresholds
Source: FCC Form 477 data as processed by TPI’s Total Broadband Dashboard. Form 477’s method of counting providers by Census block means these numbers are likely overstated.
Why Does it Matter?
For the most part, the definition does not matter. I don’t care what the FCC calls the connection that comes into my house or the choices available to me as long as they can support the services I use.
The definition is, however, crucial for identifying areas that may be eligible for subsidies and the minimum quality a provider must offer in order to receive subsidies. As the bar gets higher, more areas become eligible for subsidies while the cost of serving the truly unserved increases. The wrong definition can result in subsidies going to areas that do not need them and leaving people unconnected in areas that do.
Consider again the share of households without access to broadband at different bandwidths and combine it with bandwidth currently available to them. Approximately 4.3 million households do not have access to at least a 25/3 connection (excluding satellite). The median maximum available speed in these areas is 10/1. However, about 64 million households have access to connections that offer at least 25/3 but not 100/100. The median maximum available to these households is 940/35. In other words, according to the new definition, 64 million households with good broadband would be considered unserved and potentially eligible for subsidies, possibly crowding out the much smaller number of households without even 25/3.
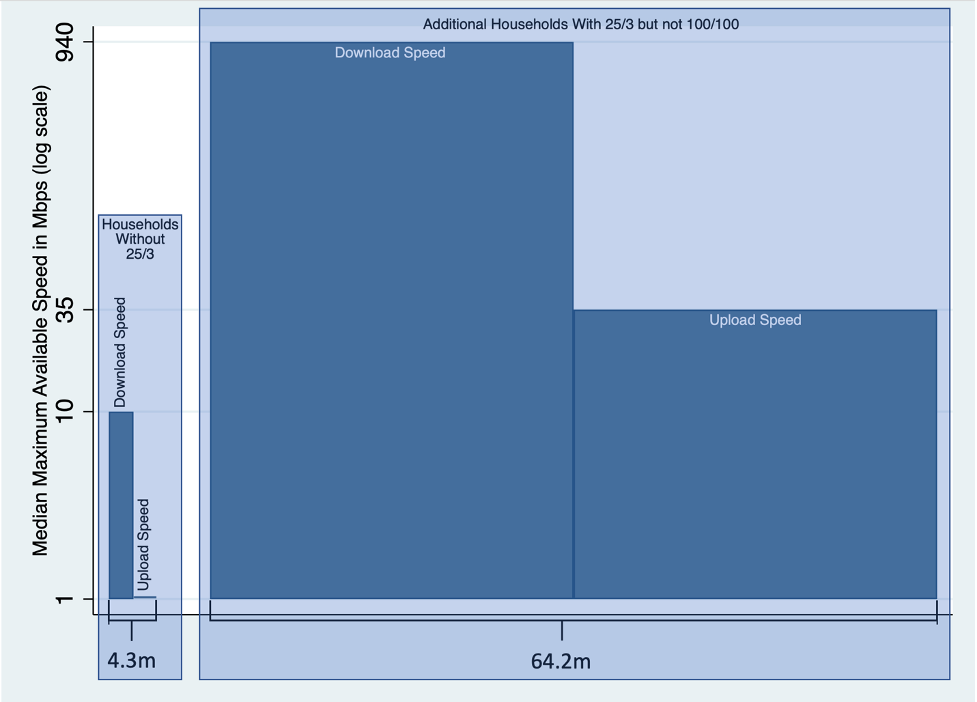
Figure 2: Share of Households Without 25/3 Service and Share With 25/3 but not 100/100 Service, and Median Maximum Bandwidth Available to Those Groups
Source: FCC Form 477 and U.S. Census as processed by TPI Total Broadband Dashboard. Height of bar is the population-weighted median maximum available bandwidth, and the width of the bars shows the number of households in that category. Note that different methods of combining U.S. Census and 477 data may yield somewhat different estimates of the number of households in each category.
How Should We Define Broadband? The FCC is Already on the Right Track
It doesn’t make sense to classify internet connections as “broadband” or “not broadband.” You don’t suddenly lose broadband if your bandwidth dips below 100 Mbps. The quality of a broadband connection depends on many factors, including bandwidth, latency, the quality of the WiFi router and other equipment on the local network, and possibly mobility.
A more consumer-based definition would take into account how people use the internet and how much they value incrementally faster speeds. The services people use do not require 100/100. The figure below shows the download and upload speeds recommended by some of the most common platforms.
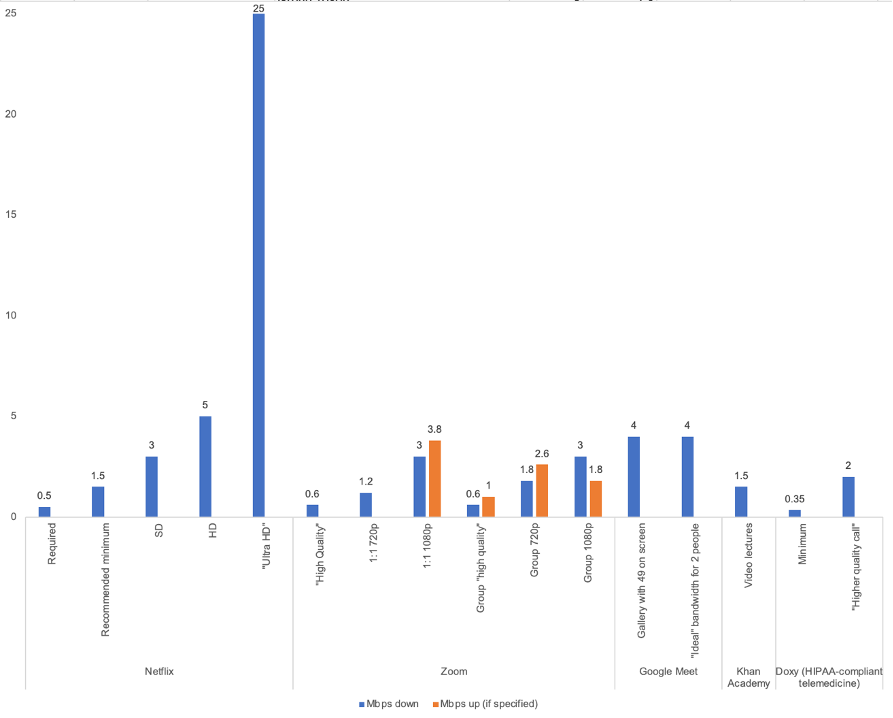
Figure 3: Recommended Bandwidth by Service in Mbps. Sources: Netflix; Zoom; Google Meet; Khan Academy; Doxy
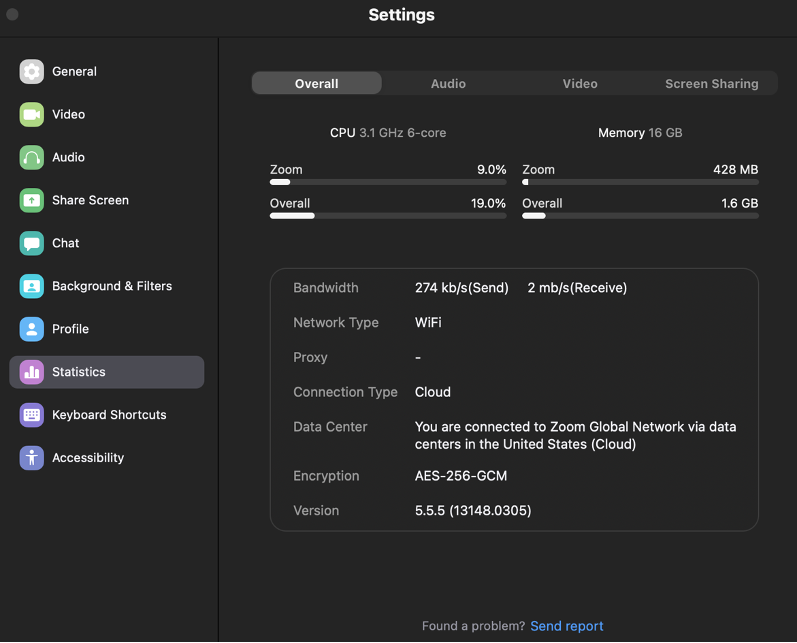
Don’t believe me? Check out the linked sources for the figure or see for yourself: The next time you are on a Zoom call, click the up arrow next to the “Start Video” button at the bottom of the screen, select “video settings,” and then click “statistics” on the left menu.
You’re likely to see that you’re using between 0.5 and 2.5 Mbps down and up. Given that distance learning and telemedicine use Zoom and similar tools, 100 Mbps does not seem particularly necessary. Click on the “audio” and “video” tabs to see other factors that affect your quality, including latency, packet loss, and jitter.
Figure 4: Zoom call with 49 people on screen, using Logitech C920 HD camera and Shure SM7B mic. My upload bandwidth is typically closer to 1 Mbps.
Even multiple people in a household sharing an internet connection are unlikely to use 100/100. In principle, you could have ten kids pretending to do Zoom school but actually doing TikToks while you’re in the other room pretending to work but actually watching Netflix, and still not run out of bandwidth.
Despite the calls for 100/100, the FCC is actually approaching measurement the right way. Its Measuring Broadband America reports evaluate several metrics, including bandwidth, latency, packet loss, and time required to load web pages, as well as consumer demand.
For distributing new universal service subsidies by competitive bidding, the FCC uses a weighting system rather than focusing on bandwidth alone. The weighting system explicitly acknowledges that several factors affect a user’s broadband experience, not just bandwidth. In the Rural Digital Opportunities Fund (RDOF) auction, the FCC used the following weighting scheme:
Performance Tier Speeds Required Bandwidth Allowance Weight
Minimum ≥ 25/3 Mbps ≥ 250 GB or U.S. average, whichever is higher 50
Baseline ≥ 50/5 Mbps ≥ 250 GB or U.S. median, whichever is higher 35
Above baseline ≥ 100/20 Mbps ≥ 2 TB 20
Gigabit ≥ 1 Gbps/500 Mbps ≥ 2 TB 0
Latency Requirement Weight
Low Latency ≤ 100 ms 0
High Latency ≤ 750 ms & MOS of ≥4 40
Table 1: RDOF Weighting
Source: https://www.fcc.gov/auction/904/factsheet
Note: The auction design applied these weights to the bidder’s monetary bid to derive comparable scores. Lower scores are better.
The weights are reasonably consistent with recent research by Jeff Prince of Indiana University and me, in which we found that people highly value bandwidth increases from slower speeds, but the marginal increase in value decreases with higher speeds. So, for example, increasing from 1 Mbps to 10 Mbps is extremely valuable, but increasing from 50 Mbps to 1 Gbps, not so much. Additionally, people value low latency, which makes sense for the real-time interactive apps people are using today.
Some might reply to these arguments by noting that the 25/3 definition is old and needs updating. That may be. A good definition in one era is not necessarily a good one in another. In 1996, a connection of 200Kbps/200Kbps was pretty good based on costs of technology at the time, existing infrastructure, and the range of applications available on the internet. I enjoy a static html page with the default font as much as the next guy, but the world moved on, and it made sense to change the definition for the purposes of considering what to subsidize.
Figure 5: ESPN homepage circa 1996
Source: https://www.businessinsider.com/the-coolest-web-sites-from-1996-2014-4
To that end, the FCC has steadily changed the definition over time, as it should:
Date Adopted Minimum Download Minimum Upload
1996 200 Kbps 200 Kbps
2010 4 Mbps 1 Mbps
2015 25 Mbps 3 Mbps
Table 2: FCC Broadband Definition Over Time
Source: https://broadbandnow.com/report/fcc-broadband-definition/
However, any new definition should be based on evidence and take into account the tradeoff between the expected costs of achieving those speeds versus the benefits of the increase. To the extent proponents of the 100/100 standard have presented any evidence, none demonstrates that the benefits of a 100/100 requirement exceed the costs.
Additionally, one argument goes, perhaps in order to encourage innovation we need to make sure networks are capable of handling future applications that will require more bandwidth. That is, we face a chicken-and-egg problem: the bandwidth has to be widely available and adopted for new services that require the bandwidth, but we won’t see those new services unless the bandwidth for them to work exists. In principle, this argument is correct. But available bandwidth has been growing steadily, while the bandwidth requirements of popular and important applications have not. No evidence suggests a 100/100 standard would promote additional innovation.
In short, big symmetric numbers might sound good, but if it’s not based on evidence then we get costs and no benefits. Let’s remember to focus on the goal: to ensure that everyone has the opportunity to participate fully in online life. The FCC is on the right track by acknowledging the multi-faceted nature of broadband and distributing new subsidies based on weighted measures of those factors. Let’s learn from and build on that.
Appendix: Share of Population with Access to 25/3 and 100/100 Broadband Service by State
| State | 25/3 | 100/100 |
|---|---|---|
| AK | 86.80% | 7.30% |
| AL | 90.30% | 30.60% |
| AR | 83.90% | 22.40% |
| AZ | 96.10% | 12.70% |
| CA | 99.30% | 50.00% |
| CO | 98.70% | 56.00% |
| CT | 99.30% | 13.50% |
| DC | 99.10% | 91.00% |
| DE | 98.90% | 57.00% |
| FL | 98.00% | 41.20% |
| GA | 95.30% | 51.60% |
| HI | 99.20% | 55.90% |
| IA | 96.40% | 40.50% |
| ID | 97.30% | 14.60% |
| IL | 98.40% | 23.20% |
| IN | 96.80% | 37.10% |
| KS | 96.00% | 38.80% |
| KY | 95.20% | 50.30% |
| LA | 90.80% | 25.40% |
| MA | 99.00% | 52.70% |
| MD | 98.80% | 62.10% |
| ME | 97.00% | 6.50% |
| MI | 96.60% | 27.40% |
| MN | 98.10% | 46.30% |
| MO | 94.30% | 34.70% |
| MS | 84.10% | 28.70% |
| MT | 90.70% | 13.50% |
| NC | 95.60% | 40.10% |
| ND | 99.40% | 46.50% |
| NE | 97.00% | 42.80% |
| NH | 97.30% | 26.80% |
| NJ | 99.20% | 68.00% |
| NM | 90.70% | 15.50% |
| NV | 98.30% | 78.40% |
| NY | 99.20% | 69.20% |
| OH | 97.50% | 25.60% |
| OK | 89.20% | 26.30% |
| OR | 96.90% | 47.10% |
| PA | 96.80% | 45.90% |
| RI | 99.60% | 84.60% |
| SC | 92.90% | 29.80% |
| SD | 96.40% | 31.30% |
| TN | 95.40% | 44.80% |
| TX | 97.10% | 46.70% |
| UT | 98.90% | 52.60% |
| VA | 96.30% | 50.10% |
| VT | 94.10% | 22.30% |
| WA | 97.90% | 41.70% |
| WI | 93.70% | 20.20% |
| WV | 85.10% | 3.90% |
| WY | 96.20% | 49.90% |
Scott Wallsten is President and Senior Fellow at the Technology Policy Institute and also a senior fellow at the Georgetown Center for Business and Public Policy. He is an economist with expertise in industrial organization and public policy, and his research focuses on competition, regulation, telecommunications, the economics of digitization, and technology policy. He was the economics director for the FCC's National Broadband Plan and has been a lecturer in Stanford University’s public policy program, director of communications policy studies and senior fellow at the Progress & Freedom Foundation, a senior fellow at the AEI – Brookings Joint Center for Regulatory Studies and a resident scholar at the American Enterprise Institute, an economist at The World Bank, a scholar at the Stanford Institute for Economic Policy Research, and a staff economist at the U.S. President’s Council of Economic Advisers. He holds a PhD in economics from Stanford University.


