
For the past three years I have been collecting data about exhibitors at the NCTA trade show from the show’s website. With this year’s show having just ended, it’s time to take a look.
Exhibitor attendance
This year, the website listed 259 exhibitors, down from 271 in 2011 and 345 in 2010. These statistics somewhat exaggerate the number of companies that participate since each company at each booth counts as a separate exhibitor. So, for example, Zodiac Interactive was represented at booth ES-59 and CableNET’s booth, so is included twice.

Hot or Not?
The show website shows the categories of products, services, or technologies each exhibitor selects to describe itself. An exhibitor can select several categories. To evaluate the prevalence of each category I total the number of times each category is selected, and then divide that by the number of exhibitors to make it comparable across years.
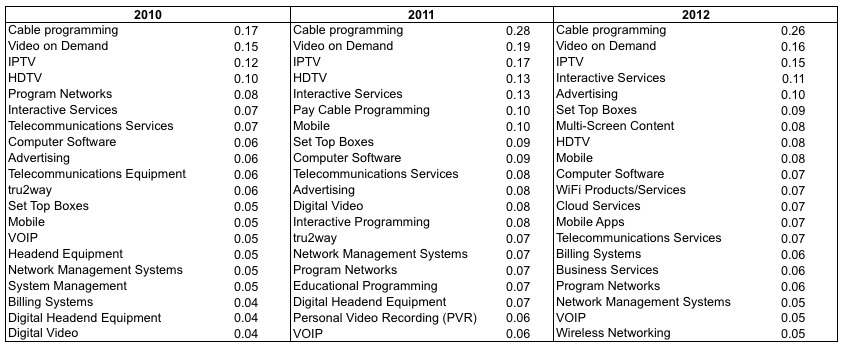
The figure below shows the top 20 categories for 2010, 2011, and 2012. The top three categories remain constant and are not surprising, given that this is the cable show: cable programming, video on demand, and IPTV.
Top 20 Product Categories, 2010-2012
Hot
The biggest winners were cloud services, mobile apps, and “multiscreen content” (although it is possible this last category was called something else in past years), which were not (officially) represented at all in previous years but were now in the top 20. Other new categories this year included social TV, broadband services, home networking, and content navigation.
Major New Product Categories 2012

“Broadband services” is rather vague and probably does not indicate any particular new product or service. The others, however, appear to represent new developments in cable. “Home networking” is related to cable companies’ interest in home monitoring services, and “content navigation” indicates interest in user interfaces that do more than change channels.
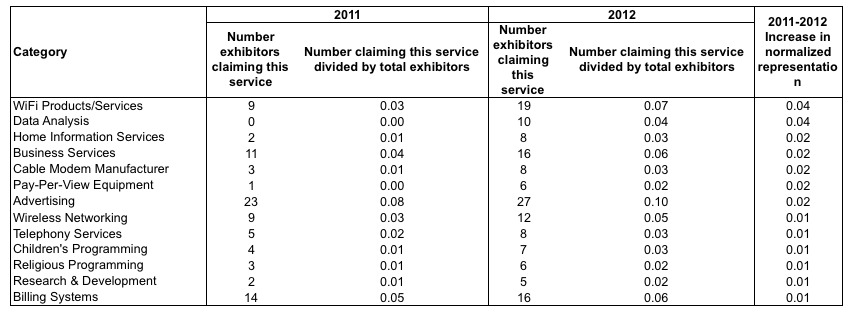
The following table shows the biggest gainers, in percentage points, for products and services that had also been exhibited in 2010 or 2011. WiFi products and services saw the biggest increase, followed by data analysis, home information services, and business services.
Biggest Gainers 2011-1012
Not
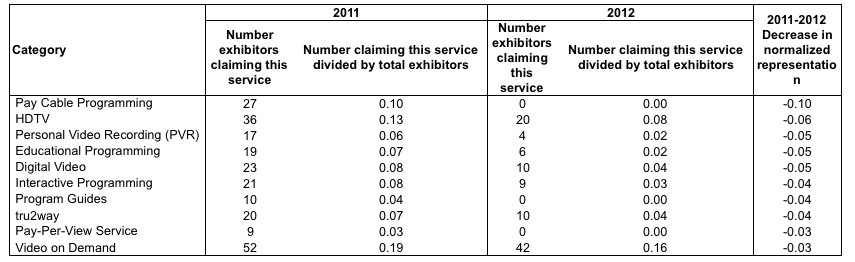
The following table shows the category losers. The biggest losers appear to be categories most associated with traditional cable television: pay programming, pay-per-view, program guides, and video on demand. Personal video recorders showed a sharp dropoff, perhaps corresponding to the increase in cloud services, meaning that the industry sees consumers less likely to be recording content at home as opposed to downloading or streaming it from the cloud. Educational programming decreased significantly, although “children’s programming” increased a bit (see above).
Biggest Losers 2011-2012
What does this mean?
The data themselves have certain problems that make drawing strong conclusions difficult. For example, they don’t control for the size of the exhibitors’ booths. NBCUniversal’s exhibit space (449), for example, is hardly comparable to Cycle30’s booth (2242). This problem is partly mitigated by larger booths holding multiple exhibitors and more categories. Additionally, the categories are self-reported by the exhibitors and do not appear to have strict definitions. Exhibitors have no incentive to select grossly inaccurate categories, since that would attract people unlikely to purchase their products, but exhibitors probably tend towards being overly-inclusive so as not to miss potential clients. This tendency might bias towards especially popular technologies. For example, perhaps exhibitors take liberties in claiming they offer “social TV” or “cloud services” because those contain popular buzzwords rather than because their products truly offer much in the way of those services.
2012 Cable Show Floor Plan

Despite these shortcomings in the data, they provide one source of information on where economic actors with money at stake think the industry is headed over the next year. And, according to them, the industry is moving away from its traditional role as linear video distributor to storing content in the cloud, trying to capitalize on trends in social everything, and providing other services like home monitoring.

Scott Wallsten is President and Senior Fellow at the Technology Policy Institute and also a senior fellow at the Georgetown Center for Business and Public Policy. He is an economist with expertise in industrial organization and public policy, and his research focuses on competition, regulation, telecommunications, the economics of digitization, and technology policy. He was the economics director for the FCC's National Broadband Plan and has been a lecturer in Stanford University’s public policy program, director of communications policy studies and senior fellow at the Progress & Freedom Foundation, a senior fellow at the AEI – Brookings Joint Center for Regulatory Studies and a resident scholar at the American Enterprise Institute, an economist at The World Bank, a scholar at the Stanford Institute for Economic Policy Research, and a staff economist at the U.S. President’s Council of Economic Advisers. He holds a PhD in economics from Stanford University.