
The FCC recently pushed out a small update to its new mapping data. The map is still in draft format and the FCC is still accepting challenges. The main changes are fixes to the availability estimates in Hawaii and Illinois. These, plus other small changes, had minor effects on the estimate of how the $32 billion in BEAD funds will be allocated based on the share of unserved locations in a state. While the changes are small, the update provides important insights into how datasets are built and maintained and how changes in the data can affect real outcomes in ways that may seem surprising at first.

THIS IS THE WAY
Building datasets is time-consuming, messy, and complicated. As Scott has said before, the FCC’s mapping data — like anyone else’s — will always contain error. And with nearly 100 Gb of data available for download, and presumably a great deal more that the FCC has to clean and process before it is usable, mistakes are inevitable. But pushing out frequent updates as they fix mistakes and gather new information is the right approach. The FCC staff has always worked hard to spot errors and fix them in its availability data. But this time it’s showing us a little bit of the sausage being made. And who doesn’t like a good data sausage?
In the next sections we look at the implications of the changes.
Real Updates to Illinois and Hawaii

The biggest updates to the map were in Hawaii and Illinois. In both cases, the estimates of the share of locations with access to 100/20 service increased substantially. Hawaii also saw an increase in the estimate of the share of locations with access to 25/3.
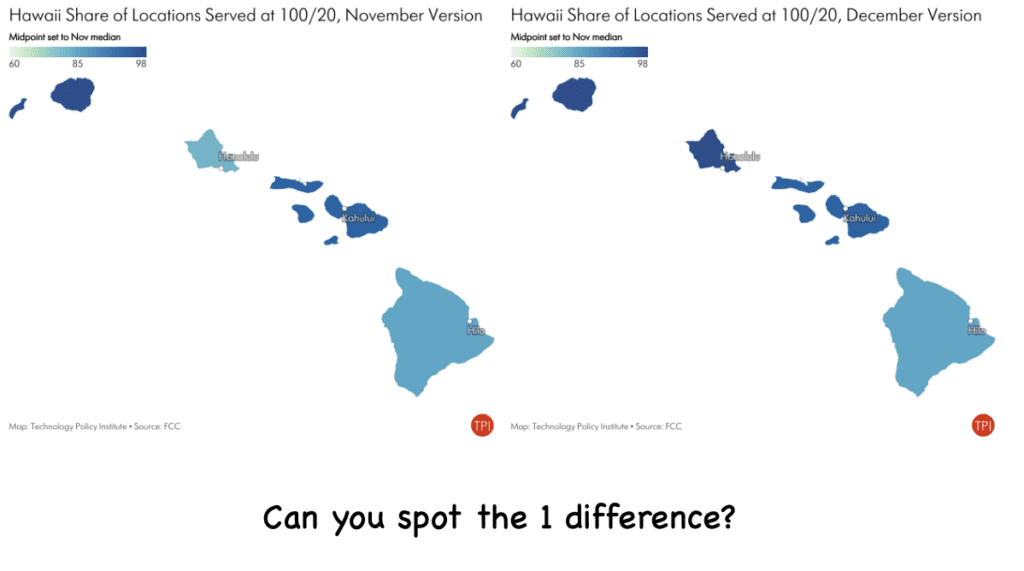
The maps below show the changes from the November to the December versions of the map. Moving the slider on the Illinois map shows how the estimates changed at the county level for the 100/20 tier. In Hawaii, the only change was on the island of Hawaii.
Illinois
Hawaii
Small Changes in Expected Funding
The figures below show how the changes in the map would translate into changes in how BEAD money is distributed. The first figure shows the change in dollars, and the second figure puts those changes in perspective by highlighting that the changes are very small relative to the amounts of money that states expect to receive.
The biggest change in expected funding is not surprising given the change in estimated availability: Hawaii's expected funding decreased by about $40 million, consistent with the estimate of the share of locations served increasing by a few percentage points, a larger change in availability than anywhere else.
At first glance, though, the lack of a change to expected funding in Illinois may be surprising given the large change there. The reason is that in Illinois the change is that many locations were erroneously classified at first as having only 25/3 coverage, while in fact they have 100/20 coverage. Because BEAD allocations are based on the share of unserved locations -- those without 25/3 coverage -- a change from 25/3 to 100/20 has no effect on allocations. (The change is not zero due to how the state's share of unserved relative to the entire country will change with changes to other states' changes in unserved locations).
But these changes barely move the needle, as the next figure shows.

Scott Wallsten is President and Senior Fellow at the Technology Policy Institute and also a senior fellow at the Georgetown Center for Business and Public Policy. He is an economist with expertise in industrial organization and public policy, and his research focuses on competition, regulation, telecommunications, the economics of digitization, and technology policy. He was the economics director for the FCC's National Broadband Plan and has been a lecturer in Stanford University’s public policy program, director of communications policy studies and senior fellow at the Progress & Freedom Foundation, a senior fellow at the AEI – Brookings Joint Center for Regulatory Studies and a resident scholar at the American Enterprise Institute, an economist at The World Bank, a scholar at the Stanford Institute for Economic Policy Research, and a staff economist at the U.S. President’s Council of Economic Advisers. He holds a PhD in economics from Stanford University.