
Introduction
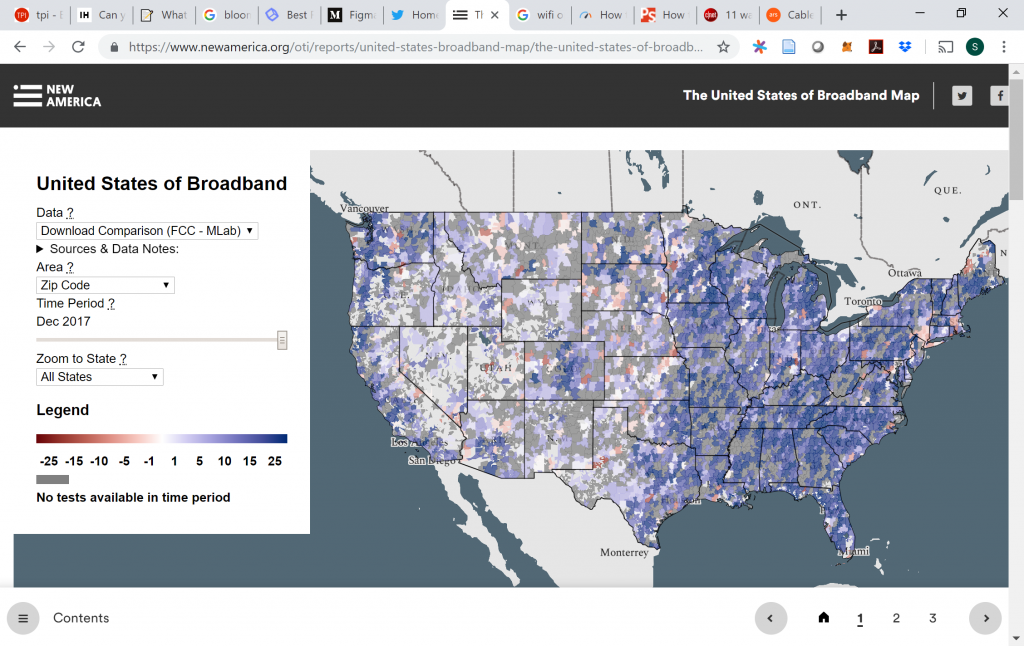
The New America Foundation’s Open Technology Initiative (OTI) recently released a report titled, “The United States of Broadband Map: Mapping the Gulf Between What ISPs Report and Actual Internet Speeds.”1 OTI introduces the map: “Are people getting the internet speeds they pay for? Our new map finds a surprising gulf between what ISPs report and actual internet speeds.” The map compares the median bandwidth consumers receive in a given area to the speeds ISPs report to the FCC as being available.2
Their thesis seems to be that people generally receive far lower speeds than they pay for from their ISPs and, possibly, that ISPs are lying to the FCC about availability.3 Those make for good headlines. Or, at least, a good tweet (Figure 1).
Figure 1: OTI’s Tweet Inaccurately Describes Relationship Between Broadband Availability and Speedtest Data4

Consumers do, in general, receive less bandwidth than they could get. But not because ISPs necessarily provide less than what consumers purchase. The ISPs report the maximum bandwidth available in a given geographic area. The speed test data show the median bandwidth of all consumer-initiated tests in the given area. The median is lower than the maximum simply because the typical household buys much less than the maximum bandwidth available. As a result, comparing the median speed received to the maximum speed available tells us very little about whether ISPs deliver the speeds they promise.
For example, I pay for a plan offering up to 110 Mbps downstream from my ISP, RCN, but RCN offers speeds up to 1 Gbps. OTI would conclude that I receive about 900 Mbps less than RCN’s reported speeds—a massive “gulf” between the actual speed I receive and what RCN presumably reports. That gulf exists, but says nothing about whether I receive the bandwidth I purchased or whether RCN truthfully reported availability to the FCC.
Figure 2. OTI’s Broadband Map Comparing Availability and Subscription Data
Directly comparing the FCC data and speed test data can be misleading because the FCC data are a measure of broadband supply while speed test data show a part of the intersection between supply and demand.6 The comparison can, however, tell us something about broadband demand relative to available capacity.
How Much Do People Value Bandwidth?
OTI’s map describes the reality that, on average, households do not purchase the maximum bandwidth available. This outcome is not surprising. Few people purchase the fastest cars available, a top-of-the-line computer, or an electrical connection capable of supporting a smelting factory, even though those goods are available. Instead, they consider their budget and what they plan to do with those goods and then choose whatever maximizes their own welfare.
Broadband is no different. People consider what they will do with their connection, the various characteristics of available connections, and their budgets, and then choose a plan among those available. While bandwidth is the most commonly discussed attribute of broadband, other characteristics include latency, data caps, and other quality indicators.
In recent research, Jeffrey Prince and Yu-Hsin Liu from Indiana University and I measured how much people value different attributes of broadband.7 In terms of bandwidth, we found that incremental willingness to pay for bandwidth decreases quickly after around 50 Mbps (Figure 3).
Figure 3: Willingness to Pay for Bandwidth
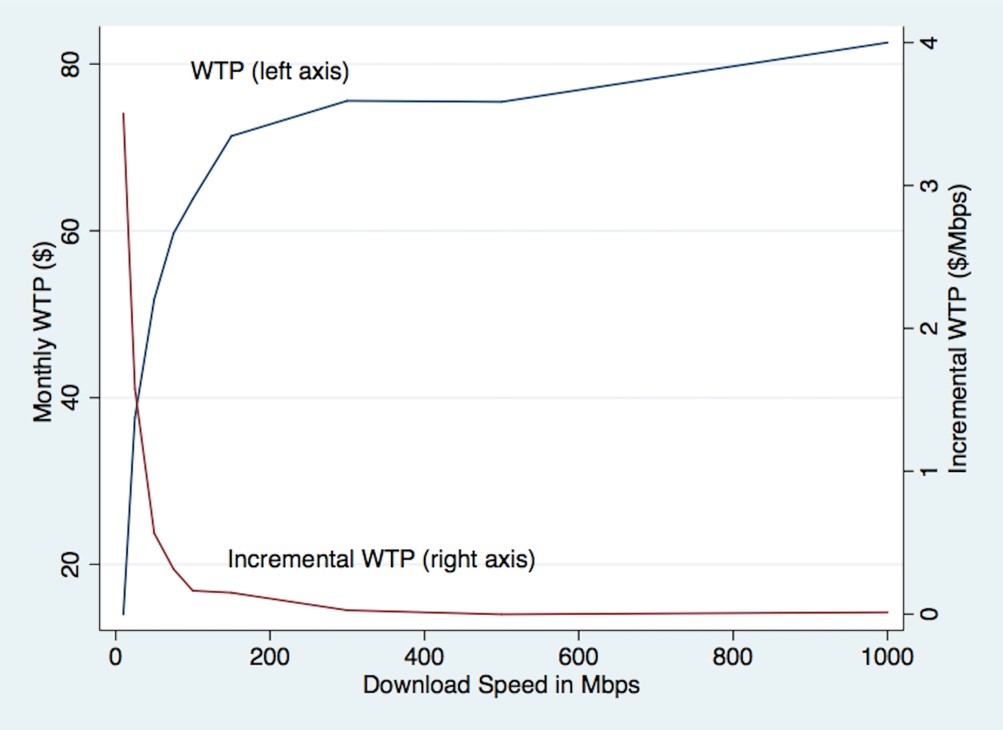
On average, people were willing to pay close to $40 per month to increase their bandwidth from 10 to 50 Mbps, another $12 to increase it from 50 to 100 Mbps, and less than $20 to go from 100 Mbps to 1 Gbps. These results make sense given that not many applications require very high bandwidth: watching HD Netflix, for example, requires only about 5 Mbps, and even 4K Netflix requires only 25 Mbps.8
Given that incremental values decrease with higher speeds, it is no surprise that speed tests find that most people tend not to choose the fastest speeds available.
Do People Receive What They Pay For?
Consumers deserve to receive what they pay for. Determining whether consumers receive the contracted bandwidth is somewhat complicated due to the combination of many factors that work together to determine speed, which includes not just how much bandwidth the ISP has truly made available to a consumer at any given time, but also the quality of the servers from which a consumer’s machine is pulling data, the networks the data has to traverse, and the quality of the consumer’s equipment.9
Under the previous administration, the FCC set out to measure whether consumers received the bandwidth for which they paid by working with the company SamKnows to measure several broadband characteristics actually received, including how much bandwidth people receive compared to the bandwidth their subscriptions say they should receive.10 The FCC continues to report on the results.
The FCC reports show that ISPs generally deliver what they promise. The Eighth Report, released in December 2018, notes, “Out of the 17 ISP/technology configurations shown, 11 met or exceeded their advertised download speed and four reached at least 90% of their advertised download speed.”11 (Figure 4)
Figure 4: Ratio of Weighted Median Speed to Advertised Speed by ISP
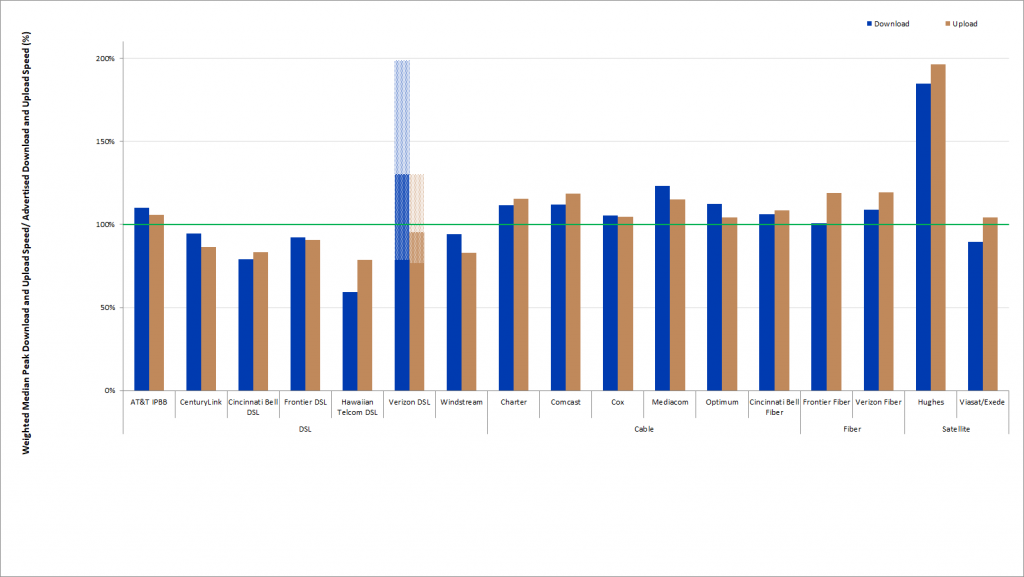
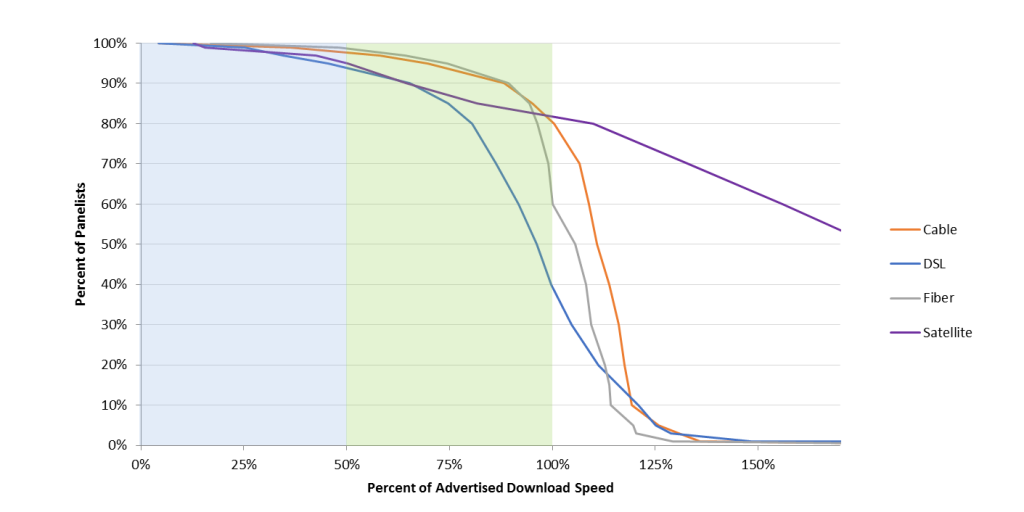
Figure 5 shows the distribution of the ratio of actual to measured bandwidth by technology. About 70 percent of subscribers of all technologies receive at least 75 percent of the promised speed. DSL performance drops off quickly, but cable, fiber, and satellite technologies perform well, with more than half of those subscribers receiving more bandwidth than promised, consistent with Figure 4.
Figure 5: Complementary Cumulative Distribution of the Ratio of Median Download Speed to Advertised Download Speed, by Technology
To be sure, the SamKnows data also show that performance varies. In addition to reporting median bandwidth levels, SamKnows also reports a so called “80/80 metric,” which shows “how consistently ISPs provide their advertised speed” (Figure 6).13 By design, the 80/80 ratio will be lower than the simple ratio of actual-to-subscription speed. The larger the difference between these ratios, the higher the variance in the speed the ISPs subscribers experience over time or area.
Figure 6: Ratio of 80/80 Consistent Median Download Speed to Advertised Download Speed
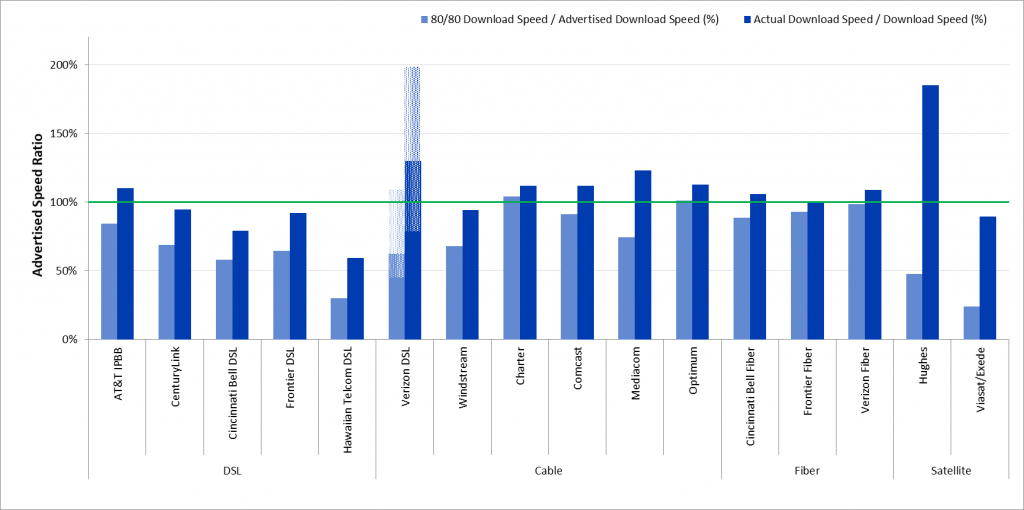
Even taking into account the 80/80 results, the data from SamKnows generally show ISPs mostly delivering the speeds they promise, with the exception of DSL, which performs worse than the other technologies, and possibly satellite, which shows significant variance in performance.
Final Thoughts: Mixing Apples and Oranges Can Yield New Flavors, But Don’t Pretend Your Oranges are Apples
OTI’s Broadband Map conflates availability data with subscription data and draws conclusions that do not actually flow from the comparison. Both measures of broadband are useful, but for different purposes. Combining datasets, too, is a key way to glean new insights; in this case it reveals information about the difference between technical capacity and consumer demand at current prices. Improving data quality is also useful. That’s the motivation behind the bipartisan proposed Broadband Data Improvement Act of 2019.14 The key is to know what each dataset actually measures rather than assuming they are different measures of the same phenomenon.
Data are
critical for policymaking, but we should start by clearly identifying the
questions we want to answer and then incorporating the right tools for
answering those questions.

Scott Wallsten is President and Senior Fellow at the Technology Policy Institute and also a senior fellow at the Georgetown Center for Business and Public Policy. He is an economist with expertise in industrial organization and public policy, and his research focuses on competition, regulation, telecommunications, the economics of digitization, and technology policy. He was the economics director for the FCC's National Broadband Plan and has been a lecturer in Stanford University’s public policy program, director of communications policy studies and senior fellow at the Progress & Freedom Foundation, a senior fellow at the AEI – Brookings Joint Center for Regulatory Studies and a resident scholar at the American Enterprise Institute, an economist at The World Bank, a scholar at the Stanford Institute for Economic Policy Research, and a staff economist at the U.S. President’s Council of Economic Advisers. He holds a PhD in economics from Stanford University.
- https://www.newamerica.org/oti/reports/united-states-broadband-map/
- OTI’s Broadband Map calculates a difference between Form 477 data and speed test data as “Download Comparison (FCC – MLab)” at the level of zip code, county, census tract, and state house and state senate district. Some components of the site, however, do not appear to function properly. In addition to choosing the level of geography, the site allows the user to choose the type of data the map shows. The options include MLab Median Download, MLab Median Upload, MLab Min RTT, MLab Download Test Count, MLab Upload Test Count, MLab Unique Download IPs, MLab Unique Upload IPs, FCC Advertised Download Speed, FCC Advertised Upload Speed, Download Comparison (FCC – MLab), and Upload Comparison (FCC – MLab). Knowing the number of tests and unique IPs is useful for considering how representative the median is likely to be, so it is good that OTI intended to include this information. Unfortunately, (as of July 22, 2019) selecting any of the test count or unique IP options simply show the MLab median speed numbers, not the counts. Presumably this is a coding error and will be corrected.
- In some cases, the map shows odd differences. In a July 17, 2019 Tweet, OTI points to a part of the map that, they say, shows, “Here in DC, speeds are 10 Mbps slower than reported” https://twitter.com/OTI/status/1151559845927149568?s=20). But the image they tweeted also shows that upload speeds consumers experience in DC in June 2017 were almost two Mbps higher than ISPs claim to offer. Additionally, the same image shows that in June 2016 consumers in DC experienced speeds in excess of 45 Mbps faster than ISPs offered. OTI would probably agree that few ISPs secretly provide that much more bandwidth than they report being available.
- https://twitter.com/OTI/status/1151542645170286592
- https://www.newamerica.org/oti/reports/united-states-broadband-map/the-united-states-of-broadband-map (Accessed July 22, 2019).
- Neither completely represents supply or demand because we do not have any measures of prices here.
- Yu-Hsin Liu, Jeffrey Prince, and Scott Wallsten, “Distinguishing Bandwidth and Latency in Households’ Willingness-to-Pay for Broadband Internet Speed,” Information Economics and Policy, July 2018, https://doi.org/10.1016/j.infoecopol.2018.07.001.
- https://help.netflix.com/en/node/306
- Many popular technology websites offer tips to consumers to optimize their Wi-Fi equipment in the home.
- https://www.fcc.gov/general/measuring-broadband-america
- https://www.fcc.gov/reports-research/reports/measuring-broadband-america/measuring-fixed-broadband-eighth-report
- The partially transparent bars for Verizon DSL reflect the different way it advertises its service. Rather than the standard “up-to” speeds, it advertises a speed range.
- The 80/80 metric is “designed to assess temporal and spatial variations in measured values of a user’s download speed” by measuring “the minimum speed that at least 80% of subscribers experience at least 80% of the time over peak periods.” https://www.fcc.gov/reports-research/reports/measuring-broadband-america/measuring-fixed-broadband-eighth-report
- https://www.congress.gov/bill/116th-congress/senate-bill/1522