
Harvard’s Berkman Klein Center recently published a report comparing broadband prices for municipal and private broadband networks in 27 communities, concluding that “community-owned fiber-to-the-home (FTTH) networks in the United States generally charge less for entry-level broadband service than do competing private providers….”
The study has two main problems. First, it is not particularly useful from a policy perspective because the price of service to an individual consumer is not the same as the cost of the network to the community. Second, even as a standalone look at prices the study is flawed because of its selection mechanism and decision to exclude DSL and all services from some competitors, particularly AT&T, from the comparisons.
We discuss both of these issues in more detail below.
Price Alone Offers Little to Inform Policy
Observing prices set by local government provides little information because we don’t know how prices were set. Prices could be low because the network was built and operated efficiently, which could be evidence in favor of a success story. On the other hand, prices could be low because politicians use public funds to offer low prices. If prices do not cover costs then the network is not sustainable without cross-subsidies or direct taxpayer support. In that case, low prices could be a symptom of a problem rather than evidence of a successful operation. Municipal broadband could be diverting public money from other pressing uses, which could range from repairing other infrastructure or reducing taxes.
The authors do not offer any policy advice, but because policymakers may draw conclusions from the data presented, it is important to point out the report’s limitations.
A bit of digging into some of the cases highlights the difficulties of drawing any conclusions from price alone.
The report estimates, for example, that a consumer could save $125 – $200 annually by subscribing to Bristol’s network rather than competitors’ networks. However, it appears that those lower prices were made possible by using other services to cross-subsidize Internet provision. The State of Virginia concluded the network could not continue operating because cross-subsidies, which funded the service, are not allowed under Virginia law.
In other words, the low prices were disconnected from the costs of building and operating the network, even though it received $22.7 million in subsidies from the 2009 stimulus program. Ultimately, the city decided to sell BVU OptiNet, which cost $185 million to build, to a private ISP for $50 million.
Other cities in the report may have had similar problems. According to the Berkman report, consumers could save $37 per year by subscribing to the Crosslake Communications fiber network, a municipal network that serves homes around some of Minnesota’s 10,000 lakes. In this case, of course, the difference between the muni and private networks of about three dollars per month is not especially significant. Moreover, like Bristol’s network, Crosslake Communications is no longer municipally owned. The network was sold to a group of three private companies in August 2016 for $6.4 million. The Berkman Center report acknowledges this sale, noting that it occurred after their research was complete. The relevant questions are why the municipality decided it should no longer operate the network and, in retrospect, whether it was a good investment from the city’s perspective.
Determining whether a network will yield net benefits—however the municipality wants to define benefits—is difficult given that, like all projections, involves predictions about future events. In 2007, for example, residents of Monticello, MN voted 74 percent in favor of building a municipal network. But proponents assumed 60 percent of households would subscribe to the service “within a few years.” As it turned out, subscription rates were only around 33 percent by 2012,[1] Monticello defaulted on $26 million in debt in 2012, and faced a class-action lawsuit in 2014. Thus, while a consumer may save $38 – $124 annually compared to the private network, as the Berkman report concludes, many citizens may have felt differently about their vote a decade ago if they had been given a more accurate prediction of the outcome.
One problem municipalities face is simply that broadband networks are expensive to build and operate, and the prices necessary to cover those costs may not be politically sustainable for those in office. Indeed, it is partly for this reason that politicians may feel pressured to offer a municipally-owned network if constituents believe prices offered by private ISPs are “too high.”
Lafayette, LA, however, shows that self-sustaining municipal networks may be possible, yet still risky. The town issued more than $100 million in bonds to build the network, which ultimately cost about $160 million and signed its first customers in 2009. The figure below shows expenses outpacing revenues as one would expect in the early stages of a capital-intensive project, with revenues finally exceeding costs in 2016. Its net asset position on the network was negative $50 million in 2016. And while that negative number should decrease as long as income exceeds costs, it remains a large liability.
Figure: LUS Fiber Expenses, Revenues, Net Asset Value
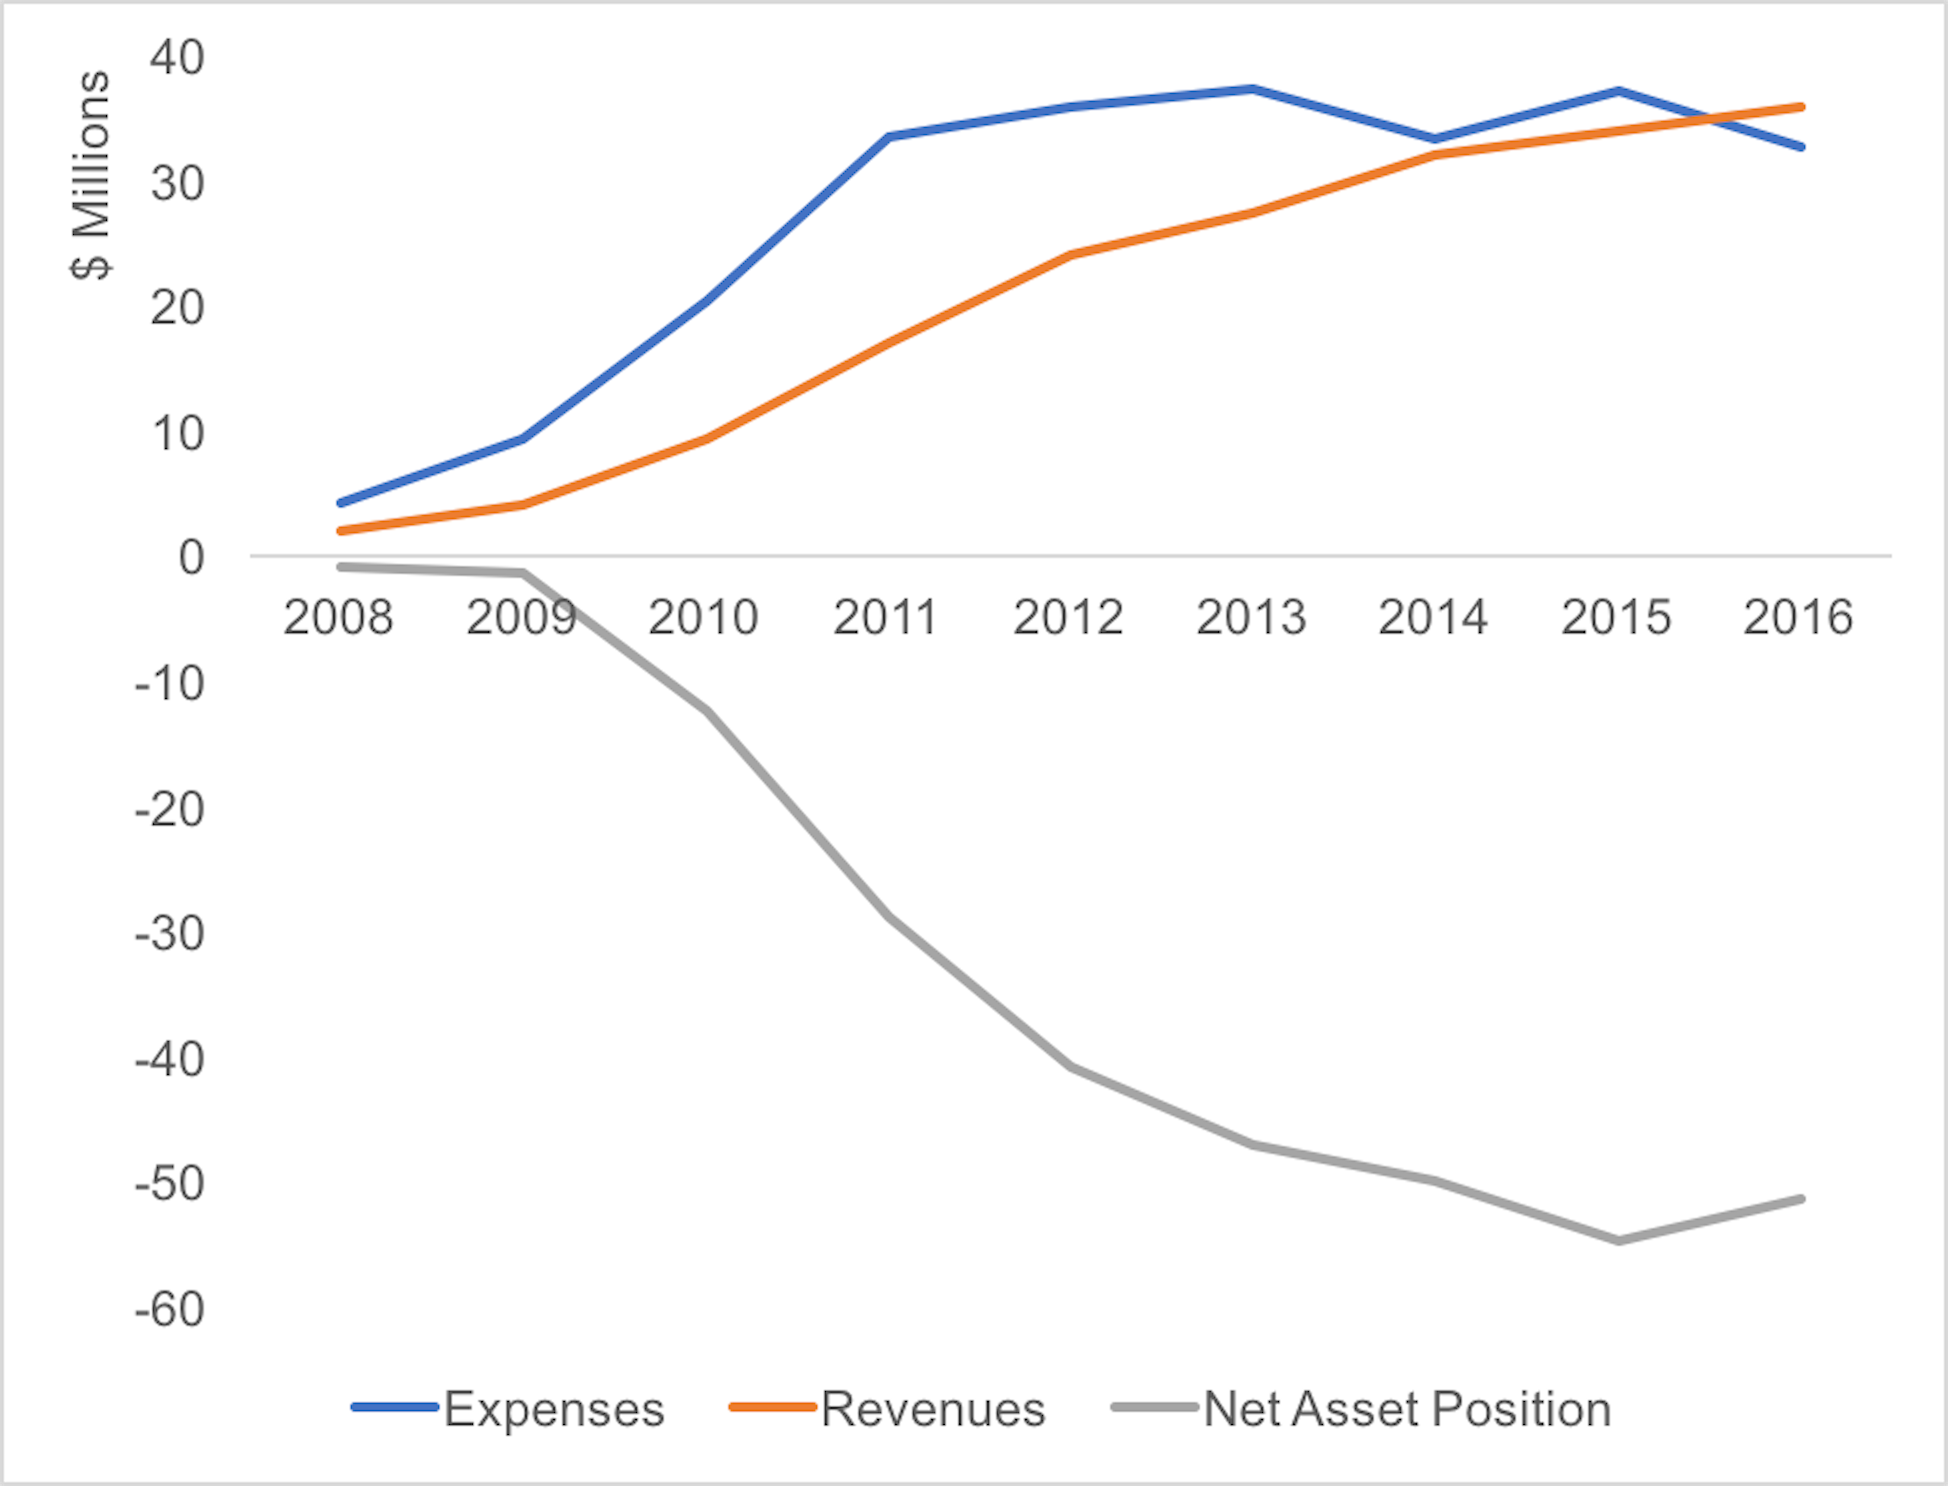
Sources: Statement of Revenues, Expenses, and Changes in Fund Net Position – Proprietary Funds For the Year Ended [2008 – 2016].
The city will have to pay its debt whether through its electricity company or tax base regardless of whether LUS Fiber continues to succeed, which is not guaranteed. In 2015, for example, Cox Communications replaced LUS Fiber as the Internet provider to Lafayette Parish Schools. LUS Fiber also faces competition from Cox, AT&T and its gigabit service, and 15 Mbps DSL service from Kaptel, all of which have plans that are less expensive than LUS Fiber (as of January 25, 2018). Increased competition, of course, and the lower prices it can bring, is partly a result of LUS Fiber’s presence.
Individual stories of success and failure are not, of course, necessarily generalizable. It is for that reason that a study’s selection methodology is so important. Unfortunately, the report’s methods prevent it from being generalizable beyond its own examples.
Community and ISP Selection Criteria Appear Flawed
While the crux of our critique focuses on the incompleteness of looking only at price, the report suffers from selection bias, as well, casting doubt even on its conclusions regarding prices.
In particular, the report’s criteria for selecting which communities, ISPs, and plans to compare within the communities are not fully explained and not conducive to drawing any generalizable conclusions.
The report “focused specifically on 40 community networks on the ILSR’s list that offer fiber-to-the-home (FTTH) service—as opposed to service from DSL, coaxial cable, or hybrid technology” (p. 4). It is important to know why the report selected those 40 communities.[2]
The report then applies additional exclusion rules to those 40 communities.
It dropped 13 of the 40 communities—five because the competitor offered only DSL and eight because the authors could not find terms of service for the competitor. DSL tends to offer slower service than other terrestrial technologies, yet DSL networks offering speeds in excess of 25 Mbps exist in the US. The FCC notes that both CenturyLink and AT&T offered such service in 2016. The report does not identify the 13 communities it dropped from the comparison.[3] We therefore do not know the identity of the communities excluded because of DSL.[4]
It is likely, but not guaranteed, that the DSL offered is slower than the community fiber network. Even so, the report could have identified the communities, given the price of the DSL, and the service provided. Readers of the report can then decide for themselves how DSL stacks up against fiber prices and speed.
The report also omits any information about AT&T service, including its fiber service, from 10 of the 27 communities studied “because of prohibitions contained in the terms of service posted on AT&T’s website.” Even though AT&T may prohibit scraping of price data from its own website, it should still be possible to find other sources of price data for AT&T service, even if crowd-sourced. A report that seeks to provide an objective price comparison can, in good faith, remedy issues of missing data, even if it means making—and explaining—some assumptions. Estimates of AT&T prices could have been included with caveats duly noted. Because of these omissions, the comparisons the report provides are at best partial.
Conclusion
We are not arguing here against municipal networks. The real question is whether municipal networks yield net economic benefits when taking into account all the costs as well as incorporating any social objectives from subsidies, such as promoting adoption by low-income residents or generating economic growth.
The Berkman Center report cannot answer the question of net benefits, nor does it claim to. That is a more complex issue, and one we will attempt to answer ourselves in a forthcoming paper that studies 130 communities with municipal networks.
____
[1] Mike Schlasner at Rochester Internet for All notes that communities “typically assume conservative take rates of 30-40% for their business case.” http://rochinternet4all.org/2016/09/01/fibernet-monticello-telecom-industry-wont-tell/
[2] By our count, the 2015 ILSR/Obama White House report lists 50 municipal networks serving 87 communities with a fiber network (not cable, partial, or INET), at 20, https://obamawhitehouse.archives.gov/sites/default/files/docs/community-based_broadband_report_by_executive_office_of_the_president.pdf. The Institute for Self-Reliance indicates that it currently counts “55 municipal networks serving 108 communities with a publicly owned FTTH citywide network.” https://muninetworks.org/communitymap.
[3] Selection bias is a top concern for social science research. The report notes that its own selection of 40 communities comes from a set of at least 80 municipalities. For each network, one community was chosen to represent the network if it spanned multiple towns. The selected community was “the community in which the network originated.” Talbot, et al. at 4. (The report does not define “originated.” We assume it means the first town to install fiber in a network). For completeness sake, we attempted to determine the 13 communities missing from the price comparison from the 2015 ILSR/Obama White House report, https://obamawhitehouse.archives.gov/sites/default/files/docs/community-based_broadband_report_by_executive_office_of_the_president.pdf. Communities with fiber networks that might have been excluded include: Loma Linda, CA, Lenox, IA, Spencer, IA, Russellville, KY, Leverett, MA, Holland, MI, Bagley, MN, Brewster, MN, Marshall, MO, North Kansas City, MO, Salisbury, NC, Wilson, NC, Sallisaw, OK, Kutztown, PA, Brigham City, UT, Chelan County, WA, Kennewick, WA, Kitsap County, WA, Okanogan County, WA, Shawano, WI, Philippi, WV, and Powell, WY.
[4] The report noted on page 5, fn, 6: “Consumers in many communities we studied do have access to DSL. AT&T’s DSL service is available in at least 10 communities we studied and Verizon DSL in at least two. We have no reason to believe these DSL services qualify as broadband, but we did not check pricing or service details because of the restrictive TOS.”