
Many services in the digital economy, like social media, require no monetary payment from users. A great deal of research has studied how to value zero-price services and how to incorporate them into macroeconomic statistics like GDP. Much less has focused on competition in zero-price markets.
But people do pay directly for zero-price services, just not through their pocketbooks. Instead of spending money, they spend time on these platforms. It is for this reason that many consumer-facing services in the digital economy are considered part of an “attention economy.” Tim Wu argued in 2017 that competition analysis should explicitly use time instead of prices.
In this post, I build on Wu’s argument by describing a time-based concentration index and considering the market power test he proposed.
Time is Money
For some time, economists have studied how to estimate how much people value goods and activities that do not have prices. Sometimes they estimate the value of so-called “non-market” activities as a function of time spent doing them and assign some representative wage rate to that time to estimate a dollar value. This approach has been used to value activities like recreation in cost-benefit analyses (e.g., Boardman) and online activities (e.g., Brynjolfsson and Oh 2012, Goolsbee and Klenow 2006, Varian 1999). Another stream of research aims to figure out how to incorporate zero-priced goods into macroeconomic and productivity data (Byrne and Corrado 2019, Hulten and Nakamura 2018).
Businesses have also used time to measure the value of their products. Entrepreneurs and venture capitalists in the dot-com bubble of the late 1990s counted “eyeballs”—how many people used a site and how long they stayed on it—as a measure of how well they were doing. In that era, we learned that eyeballs by themselves were not as valuable as many hoped. But eyeballs still matter, particularly when you take into account the rest of the body attached to them. Today we call it the “attention economy,” and firms compete for the ultimate limited resource—your time (Wu 2016, Evans 2017).
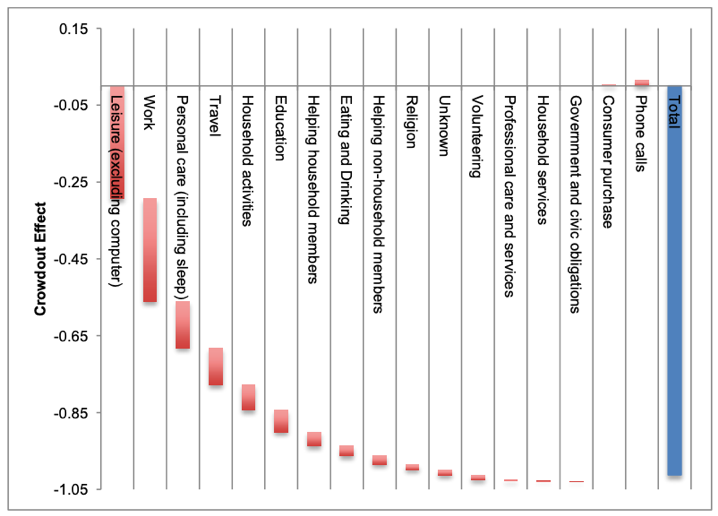
One implication of measuring time in the attention economy is that it allows us to estimate the opportunity cost of online activities. Because time is finite, if you do more of one thing, you must do less of another thing, multitasking notwithstanding. In a 2013 paper that used data from 2003 through 2011, I estimated the cost of online activities in terms of things people did not do when they were online. The figure below shows the estimated crowding-out effect of online during those nine years.
Figure 1: What Were We Not Doing When We Were Online, 2003-2011
The concept of opportunity cost is not unrelated to competition. Opportunity cost is what you give up when you do something. If you pay for a good or service, the opportunity cost is the next-most valuable good or service you could have bought with that money. If you spend time on an activity, the opportunity cost is the next most valuable activity you could have done instead.
The notion of time as a cost and a currency you pay gives us a tool to evaluate competition in certain areas that have largely eluded us so far.
Competing for Your Time
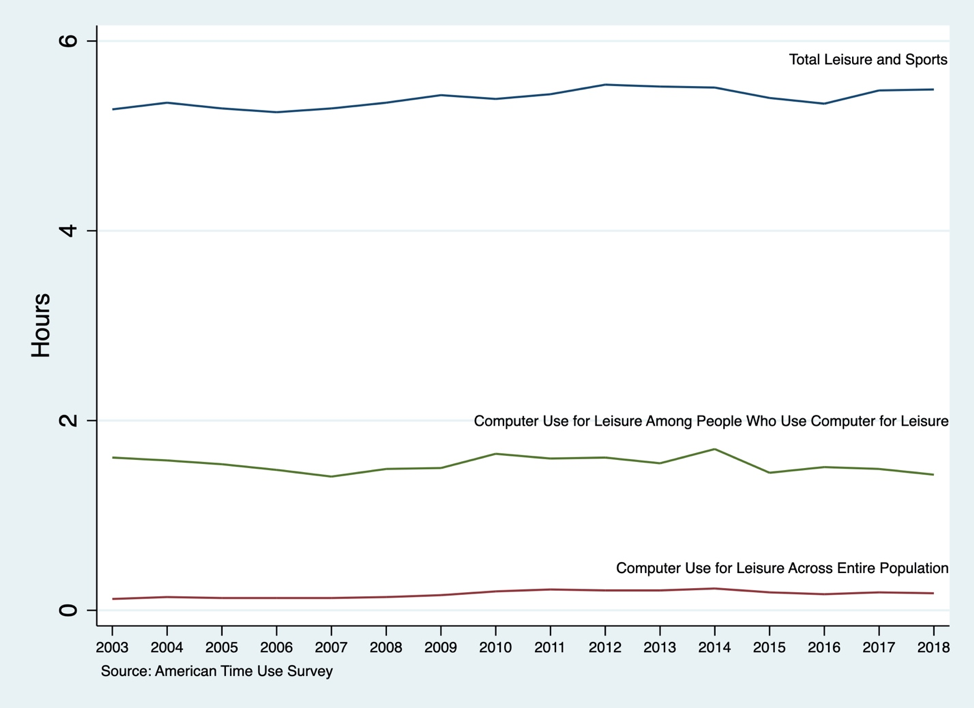
People have a relatively fixed amount of time available in a given day for broad categories of activities, including leisure. The American Time Use Survey has found that average leisure time has remained steady at just over five hours per day, on average, since the survey began in 2003. People choose among a set of activities to fill those hours.
Figure 2: Leisure Time, Americans 18 Years and Older
The more likely someone is to choose among a set of activities, the more likely those activities compete with each other for our time. For example, many people might choose between running and biking as a way to spend an hour, while far fewer people are likely to choose between running and building an aquarium. Running and biking are at least partially “attention competitors” while running and constructing aquariums probably are not.
Running and biking are not perfect competitors, but perfect competition is rare outside of commodities. That’s why estimates of cross-elasticities—how much prices and quantities of good A changes as the price of good B changes—are so important. The more demand for good B increases as the price of good A increases, the more strongly A and B compete with each other.
Defining Markets in the Attention Economy
The more that time spent on one activity affects time spent on another activity, the more those two activities compete with each other. With online activities like social media, therefore, we can begin to define markets and estimate measures of competition using time instead of prices.
Under this approach, potential competitors to Facebook are not just new versions of Facebook, although those exist. Google tried unsuccessfully to create a new Facebook in the form of its product Google+. Some other companies, like MeWe, Sociall, and others continue to try to take on Facebook directly, as well.
The real competition is for people’s time. A potential competitor to Facebook is any activity that would cause people to spend less time on Facebook. Possibilities include not just new social media platforms, but also streaming video and Esports, and perhaps even running and biking.
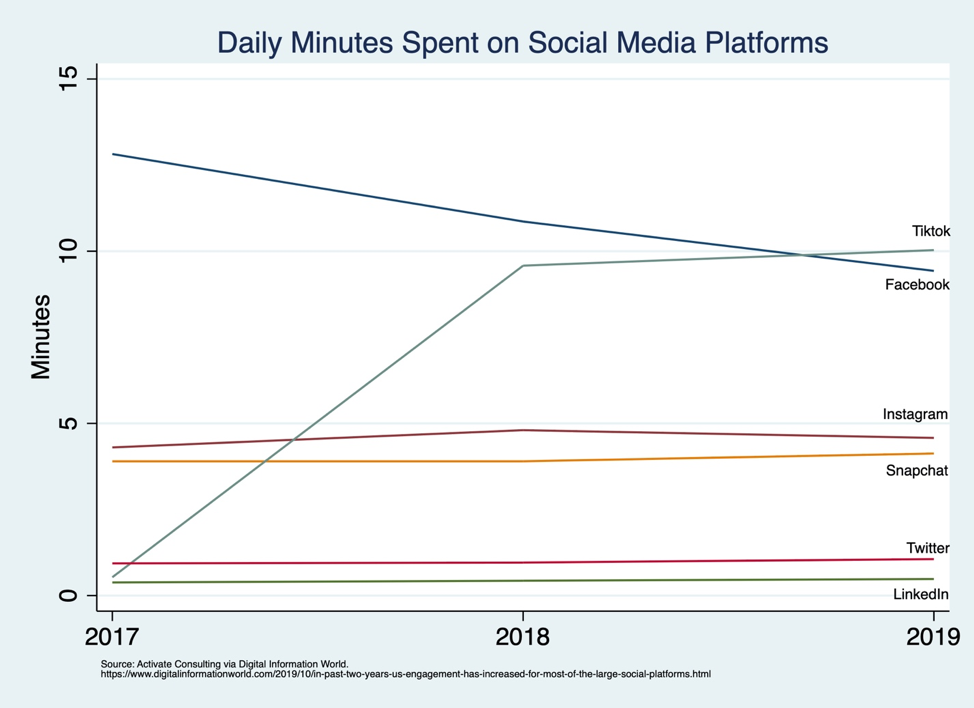
Tiktok, for example, launched in 2017 and had more engagement by users than Facebook by 2019, according to one source. At the same time, this source shows Facebook engagement decreasing. This negative correlation does not, of course, necessarily mean a significant share of people stopped spending time on Facebook in order to spend time on Tiktok. But it is possible, and worthy, of investigation.
Figure 3: Daily Minutes Spent on Social Media Platforms
If we accept that time spent is the price, then we can begin to think even further about competition. For example, how concentrated is this market? As always with this question, it depends how the market is defined.
With enough data—which exist through firms like Nielsen or Comscore who measure complete online behavior in a representative sample of households—it is possible to empirically test how much social media competes for broader leisure time versus competing for a subset of that time. When someone, for example, chooses to make and post a TikTok, how much of that time took the place of time spent biking and how much took the place of time spent on Facebook?
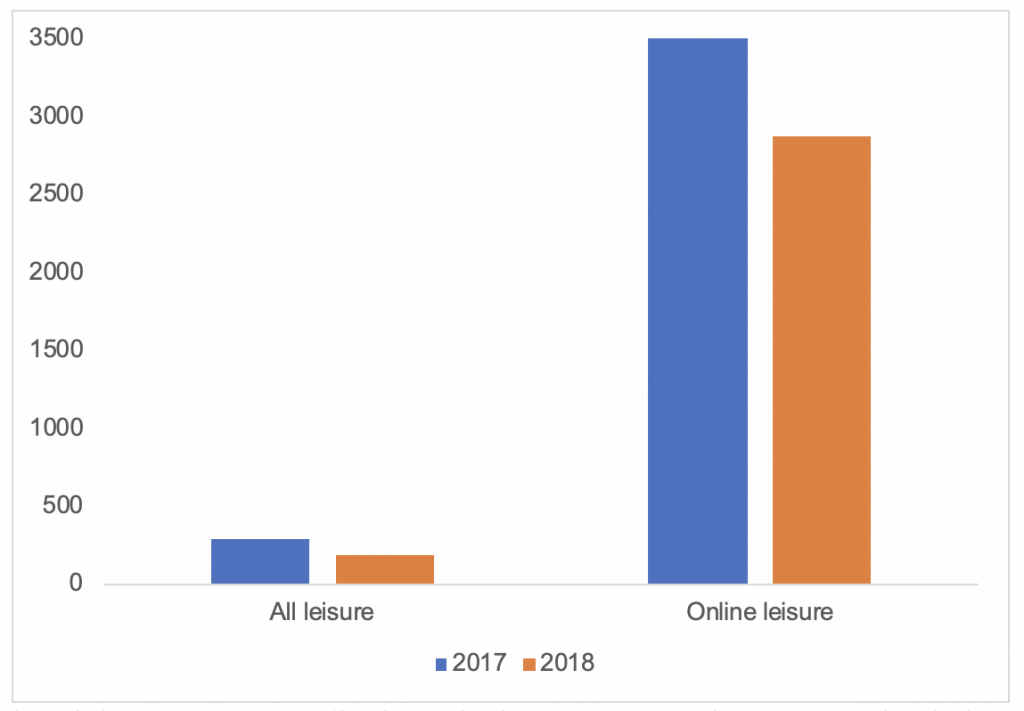
Let’s consider market concentration under two scenarios: One where the time market is for all leisure and another where the relevant time market is leisure time spent online, which is a subset of total leisure. Leisure time data come from the ATUS, while time spent on different social media platforms come from the source in the Figure above.
Figure 2 above shows that considering leisure time to be a fixed resource seems sensible. Total leisure time has not changed much since the ATUS survey began in 2003. Similarly, computer use for leisure, which, in the ATUS survey, includes social media, has also remained fairly constant since 2003.
Time-Based HHI
Figure 4 shows the HHI concentration indicator calculated under the two scenarios. Under the broad definition, in which social media competes for all leisure time, the market is not concentrated. Under the narrower definition, in which social media platforms compete for online leisure time but not for offline leisure time, two points stand out. First, the market in 2017 exceeds the threshold to be considered “highly concentrated” under the FTC-DOJ Horizontal Merger Guidelines. Second, Tiktok’s entrance made a noticeable difference, causing the HHI to drop by about 1050 points between 2017 to 2018, leaving social media “moderately concentrated” by the FTC-DOJ threshold levels.
Figure 4: Social Media HHI Under Different Market Definitions
OK, But Then What? SSNIP, SSNIP
The Horizontal Merger guidelines use the HHI thresholds as one indicator of whether a given merger should be investigated, not whether it should be blocked or allowed. That determination requires further detailed analysis.
A full competition analysis requires more rigorous tests, and our standard tests again rely on prices and quantities. While the right data make it possible to estimate how much time spent on one activity changes in response to time spent on another activity, such estimates are not price elasticities. Cross-price elasticity is the percentage change in quantity of good B divided by the percentage change in the price of good A.
When the monetary price is zero, time becomes both price and quantity.
This distinction matters in competition analysis because antitrust often relies on the “SSNIP test”—a way to identify the smallest relevant market in which a hypothetical monopolist could profitably increase prices (SSNIP = Small but Significant Nontransitory Increase in Price). If time spent on a service is both price and quantity, then the firm has no behavior to test.
In his 2017 paper, Wu proposed an alternative way to conduct a SSNIP test. This “attentional SSNIP test” involves using the “advertising load” of a service as the key variable instead of price changes. One version of this test would be to examine how changes in the length of video advertisements—and therefore how much more time a site tries to make people spend—affects consumer behavior.
Elasticity of Attention
Some publicly available data make it possible to see how this might work in practice. For example, online videos routinely include advertisements that run before the video will play. These come in different forms—full-length advertisements of various lengths that the viewer must watch in order to continue to the desired video ranging to ads that can be skipped after a few seconds. According to one source, the industry standard for a video ad is 20 seconds.
This source reports on an experiment that tested how the length of an ad affected viewers’ likelihood to finish watching the ad. We have no information on the validity of the experimental design, but if we assume it was done properly, we can estimate an “attention elasticity.” Figure 5 shows a graph of the data presented by this source.
Figure 5: Attention Elasticity
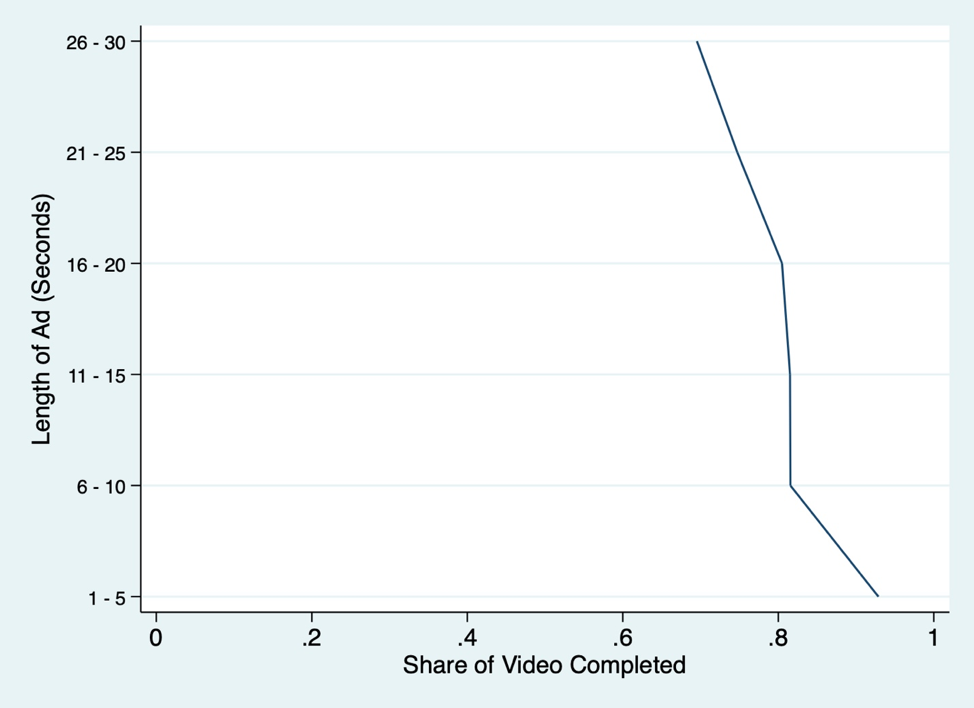
The figure seems to show a highly inelastic demand for watching videos, with an average elasticity of about -0.14 across this range. To complete the test, we would need to know how much more or less utility the viewer gains from watching different ad lengths. Does a viewer gather the most information in the first few seconds of an advertisement and then does it drop off afterwards? Or does a viewer value the information later in a video clip with a storytelling element where the later seconds matter more than the beginning?
Don’t Forget the Other Side of These Platforms
As is routinely (and correctly) noted, most of these platforms are two-sided markets. The viewers discussed above are one side of this market. The other side typically includes advertisers, and their surplus matters to the total welfare function, as well. The change in their net surplus is also a function of ad length and whether the viewer clicks on the ad, but the function may not be the same as the platform’s.
The advertiser’s elasticity of supply of ad length depends on the advertiser’s goals for impressions and click conversion rates. To measure the elasticity of supply of time watching an advertisement or video, more data would be needed on the profit the firm earns at different ad lengths. The near-perfect inelasticity between 6 and 20 seconds suggests that the firm decides to post a 6-second ad they would always earn higher profits by posting a 20-second ad instead, which is consistent with their conclusion that 20-second ads are the most profitable. While still relatively inelastic beyond that, we would need additional data to determine whether increasing required watching time of an ad beyond 20 seconds is likely to be profitable or not.
You’re So Extra
Another possible difficulty in applying any of these tools to the digital economy is the relative newness of aspects of parts of this economy, such as social media.
Nobody saw TikTok coming, and by itself it caused the time-based HHI to decrease by over a thousand points in a single year according to estimates described above. Is such a large and quick change something we should expect in the digital economy, or will we come to learn that this change is unusual? Put another way, how high and persistent are barriers to entry?
A research agenda to study time-based HHI would need to include a historical review of changes in time spent on social media platforms over time. Such estimates would be based on SSNIP and other approaches and would help put any of today’s or tomorrow’s estimates in context.
Before antitrust enforcers, practitioners, and courts can incorporate such novel theories of market definition, more economic theory and empirical analysis needs to be established and peer-reviewed.
Concluding
The question of how to evaluate competition in certain digital markets is at the forefront of policy debates today. One problem is that our standard antitrust tools do not always fit zero-priced goods particularly well. However, that can be remedied by thinking more creatively about how to use the currency people spend—their time—within the existing framework, as Wu first outlined.
Doing so is not straightforward, and we (or, at least, I)
may not yet fully understand how to interpret the results but taking time
seriously as an analytical tool can help put us on the road to building a
framework for rigorously evaluating competition in these important markets.